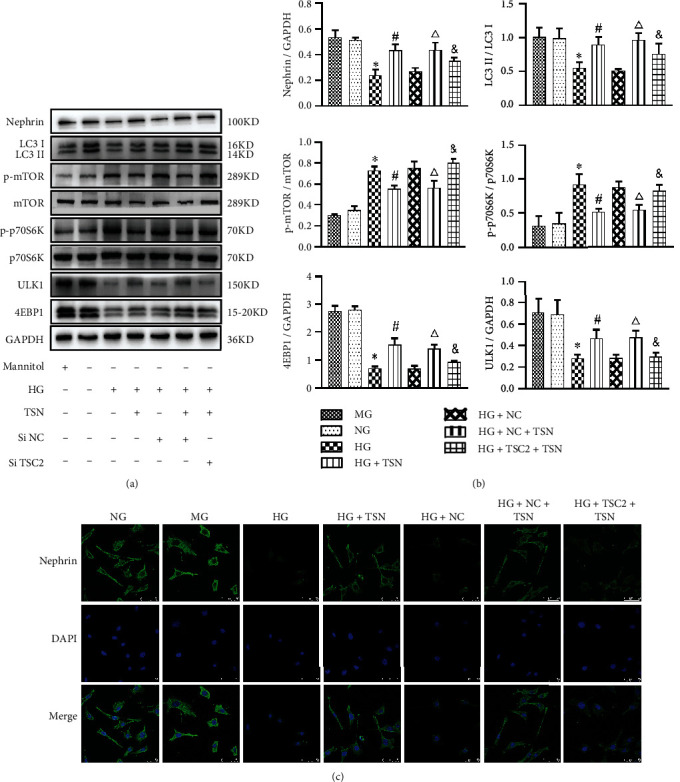
Figure 7.

Effect of TSN on the mTORC1 activation, LC3II, and nephrin in high glucose-induced podocytes. (a–b) Representative Western blot bands and quantification of nephrin, LC3II/I, mTOR, p-mTOR, p-p70S6K, p70S6K, ULK1, and 4EBP1 protein expression. Data were shown as the mean ± SD, n = 3; ∗P < 0.05 versus the NG group, #P < 0.05 versus the HG group, △P < 0.05 versus the HG + NC group, &P < 0.05 versus the HG + NC+ TSN group. (c) Representative immunofluorescence photographs of nephrin in each group, magnification ×630, scale 50 μm, n = 3.
