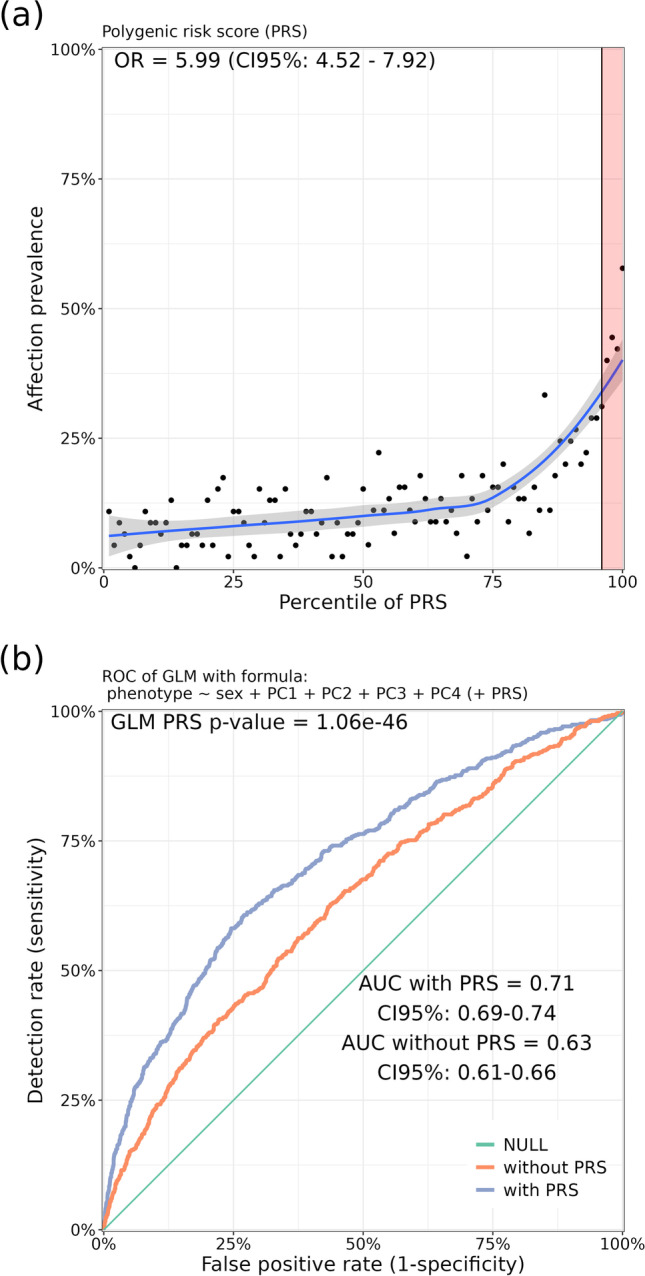
Fig. 2.

Risk gradient for PSC affection status according to the polygenic risk score (PRS) percentile and corresponding receiver operating characteristic curve (ROC) for a resulting (very weak) diagnostic test. a 100 groups of the test data set were derived according to the percentile of the PSC-specific PRS. The prevalence indicated on the y axis of the graph refers to the ratio of cases to controls in the genotyped sample. Odds ratio (OR) was calculated by comparing individuals with high PRS (top 5%) with the rest of the population (remaining 95%) in a logistic regression model adjusted for sex and the first four principal components (PCs) of ancestry from principal components analysis (PCA) with GWAS data. b Sensitivity: proportion of affected individuals with positive test results. False-positive rate (1—specificity): proportion of unaffected individuals with positive test results. AUC: area under the curve
