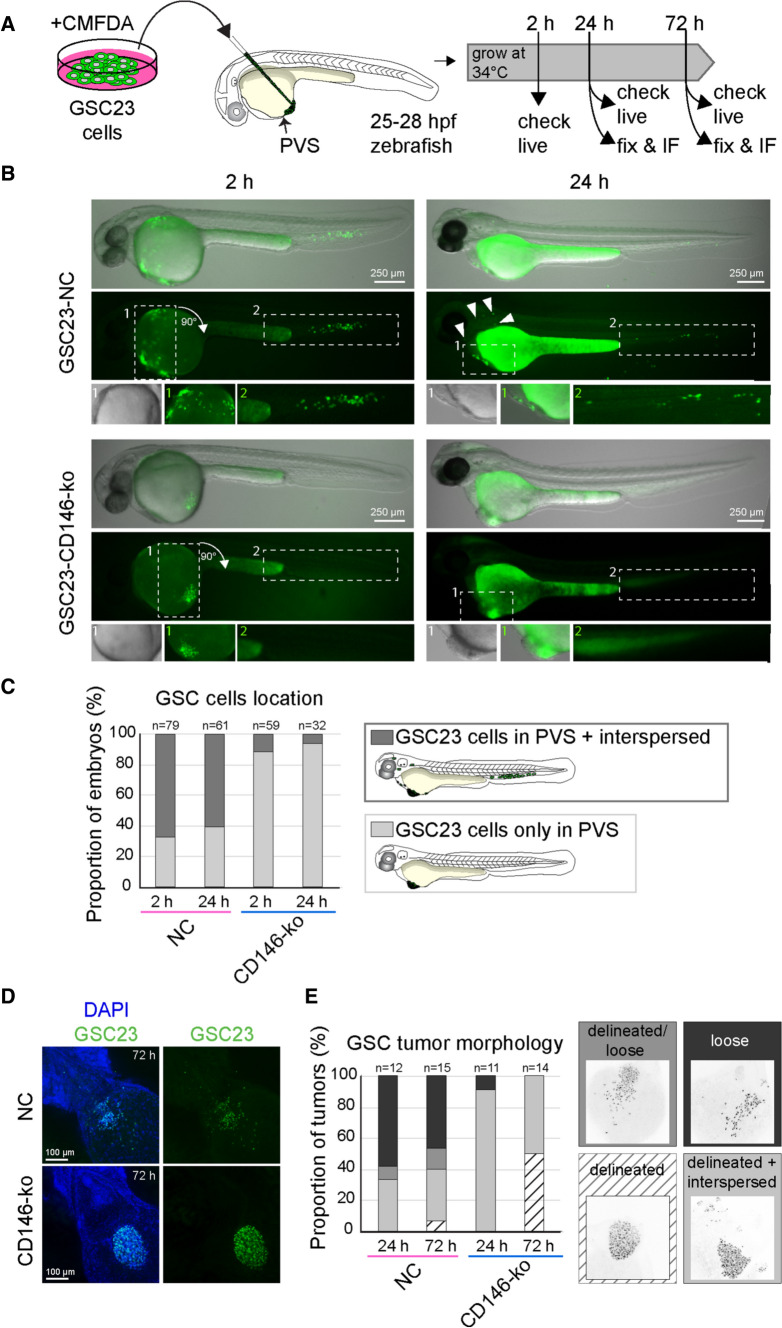
Fig. 4.
GSC23-CD146 knockout cells showing reduced migration/invasion in a heterotopic xenograft zebrafish model. A Schematic outline of the zebrafish PVS xenograft procedure. GSC23 control and GSC23-CD146-ko neurospheres were dissociated and stained with a green fluorescent dye (CMFDA) prior to injection into the perivitelline space (PVS) at 25–28 h post-fertilization (hpf) in Casper (transparent) zebrafish embryos. Xenografted embryos were assessed and fixed for further analysis at several time points after transplantation. B Representative fluorescence stereomicroscope images of a live zebrafish embryo containing either xenografted GSC23 control (top row) or CD146-ko (bottom row) cells at 2 hpt (left column) and 24 hpt (right column). Shown are overlays of transmission light/fluorescence (top image), fluorescence channel only (middle image), and magnifications of indicated regions of the embryo (bottom images). Arrowheads indicate sparse individual GSC23 cells. C Qualitative assessment of the proportion of embryos with differential location of control (pink) versus CD146-ko (blue) GSC23 cells (see schematic drawing). Light gray indicates embryos with cells only in the PVS, dark gray indicates embryos harboring cells in the PVS and in the embryo proper (tail, trunk, head). Results are from N = 3 independent experiments with total n of embryos indicated above the bars, in which embryos that died between 2 and 24 h or without successful engraftment at 24 h were excluded from the 24 h bars. D Representative maximum projection confocal images of fixed xenografted embryos at 3 dpt with nuclei stained with DAPI (blue) and anti-human nucleoli antibody (green) to visualize the GSC23 cells. The images show a ventral view of the jaw, heart, and anterior yolk region of the embryos where the PVS tumors are located. Anterior is to the top left and posterior to the bottom right. E Qualitative assessment (categorization) of GSC23 PVS tumor morphologies in control (pink) and CD146-ko (blue) xenografts at 1 and 3 dpt. These categories were as follows: (1) delineated (white, striped), defined as compactly packed tumor with defined border with fewer than 10 cells outside the tumor; (2) delineated + interspersed (light gray), a compact delineated tumor with more than 10 interspersed or clustered cells outside the tumor; (3) delineated/loose (middle gray), a tumor that is partially compact with clear boundary and partially loose; and (4) loose (dark gray), a tumor with clear intercellular distances and absence of defined tumor boundary (E). Results are from N = 3 independent experiments with total n of embryos indicated above the bars. Scale bars in B = 250 μm; scale bars in D = 100 μm

