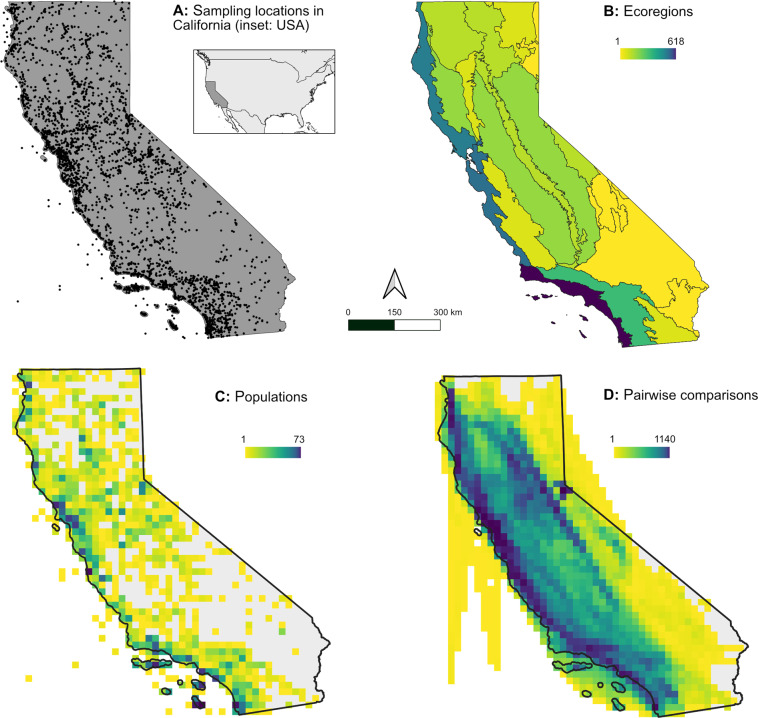
Fig. 3.
Maps of data contained in the CaliPopGen databases. (A) All unique sampling locations of both the population genetic (Dataset 121) and pairwise comparison (Dataset 221) data. The inset shows the location of California within the contiguous USA. (B) The number of unique populations in CaliPopGen per California ecoregion. Note the relative under-representation of inland desert regions (yellow) and over-representation of coastal ecoregions (purple-blue). (C) The number of unique populations of the populations genetic Dataset 121 per 20km raster cell. (D) The number of straight-line pairwise comparisons of Dataset 221 per 20km raster cell.

