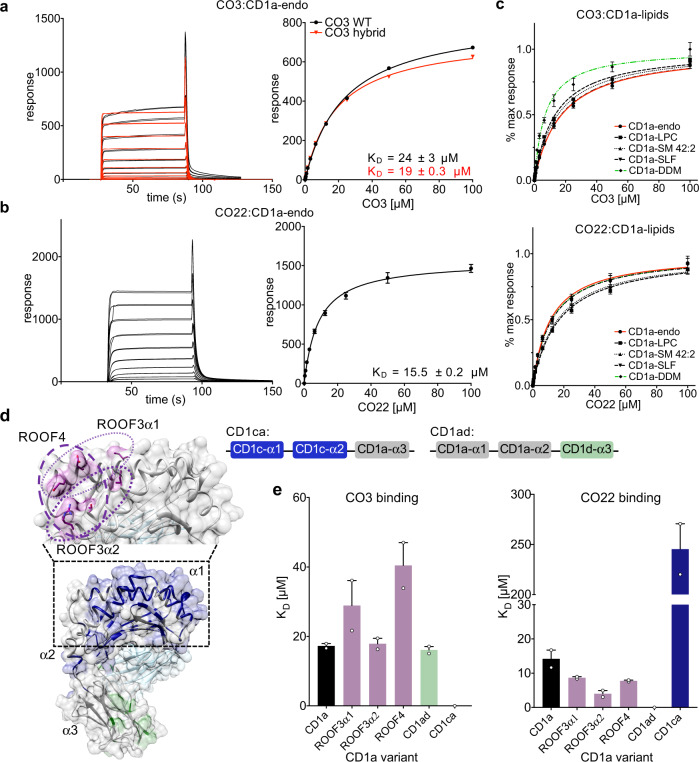
Fig. 2. CD1a binds γδ TCRs in vitro.
Surface plasmon resonance (SPR) sensorgrams and calculated binding curves for CO3 (a) and CO22 (b) γδTCRs injected over a flow cell containing CD1a-endo. Comparison between HEK293S-cells produced (black) and refolded hybrid (red) TCR is shown for CO3 γδTCR. c SPR data showing normalised binding curves between CD1a-endo (red curve) or loaded with different ligands (self-lipids: black symbols, DDM: green) to CO3 (top) and CO22 (bottom) γδTCRs. The curves shown in a–c are representative of one experiment. Dissociation constants were calculated from two independent experiments (n = 2). For each concentration the points represent the mean and the error bars correspond to SD. d Engineered CD1a variants used to elucidate the binding determinants of the γδ TCRs. The side chains of mutated residues across the A’ roof (top) are shown in pink. The domain-swap chimeras (bottom) contain residues corresponding to human CD1c (CD1ca: navy blue) and human CD1d (CD1ad, light green). Light grey areas correspond to wild-type CD1a residues. The origin of the α domain in each construct is shown in the box diagram. e Dissociation constants of the binding between CO3 (left) or CO22 (right) γδ TCRs and wild-type CD1a (black), CD1a A’ roof mutants (pink), CD1ad (green), and CD1ca (navy blue) chimeric proteins were calculated from two independent experiments. The error bars correspond to SEM. Source data are provided as a Source Data file.

