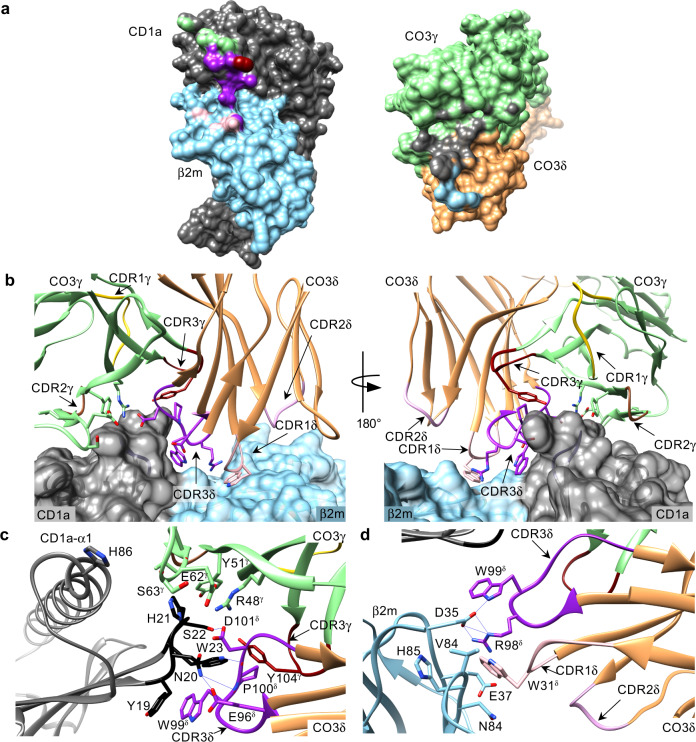
Fig. 4. Interactions between CD1a and CO3 γδ TCR.
a The surface of CD1a (dark grey) and β2m (blue) heterodimer (left) involved in the interaction with CO3 γδ TCR. The area buried by the interaction with CO3 framework (FR) γ is shown in green, with CDR3γ in dark red, with CDR1δ in light pink and with CDR3δ in purple. Within the footprint of the Ag-presenting molecule on the TCR (right, CO3γ in green, CO3δ in orange) 70% of the BSA corresponds to CD1a (grey) and 30% to β2m residues (blue). b Both chains of the γδ TCR are involved in the recognition of CD1a/β2m (grey and blue). CO3γ chain contribution is limited to the FR γ region (green) and CDR3γ loop (dark red) and does not involve CDR1γ (yellow) or CDR2γ (brown) loops. CDR3δ loop (purple) from the δ chain (orange) of CO3 penetrates the cavity between the heavy chain and β2m and contributes to 40% of total BSA, CDR1δ (light pink) constitutes additional 20% of the interface area and CDR2δ loop (dark pink) does not participate in the interaction. The side chains of the CO3 residues contacting CD1a/β2m are shown. c The side chains of CD1a and the CO3 γδ TCR residues involved in the complex formation are shown and labelled. The core of the interaction corresponds to the 19-23 loop (black) of CD1a (grey) that make extensive hydrogen bonds (blue lines) with the framework region of CO3γ (green), CDR3γ loop (dark red) and CDR3δ loop (purple). d The side chains of β2m and the CO3 γδ TCR residues involved in the TCR complex formation are labelled, showing electrostatic interactions between β2m (blue), CDR1δ (light pink) and CDR3δ (purple) loops.

