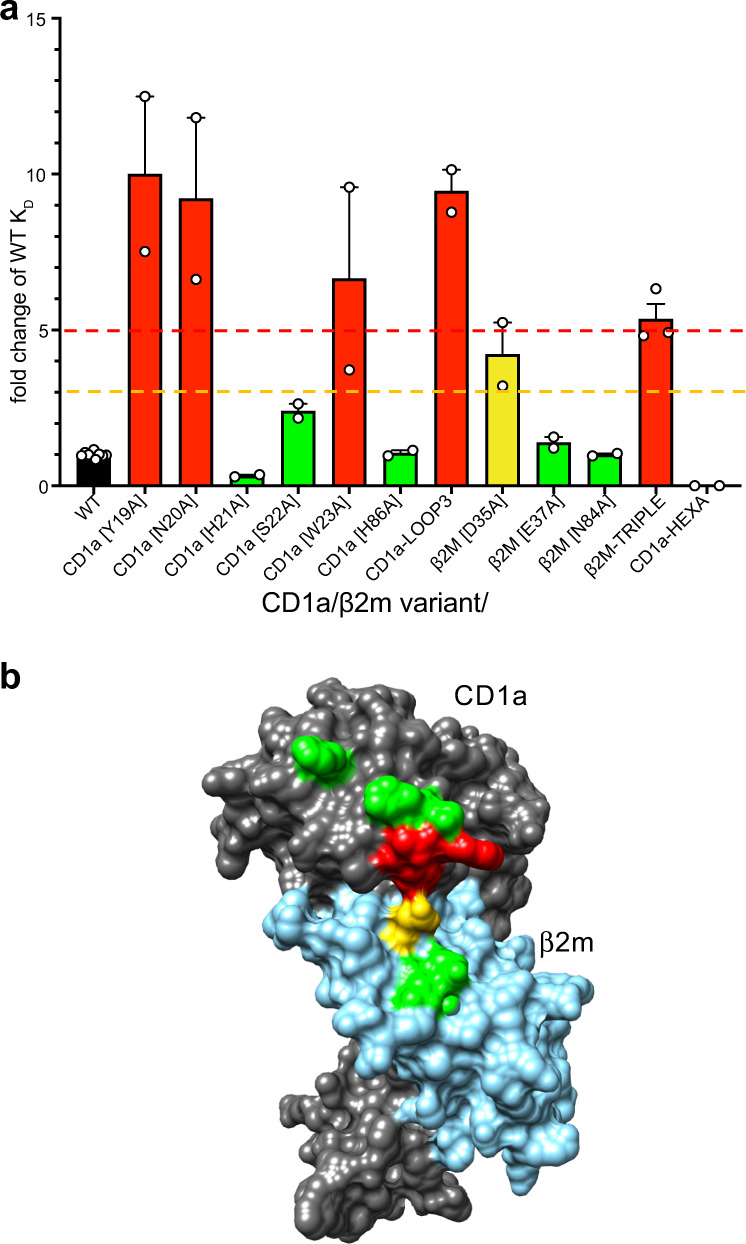
Fig. 6. Energetic landscape of CD1a-CO3 γδ TCR interaction.

a SPR was used to measure the binding affinity between CO3 γδ TCR and CD1a containing single or multiple mutations across the CO3-CD1a complex interface. Green (KD change < 3-fold), orange (3 to 5-fold decrease in KD) and red (>5-fold decrease in KD) bars summarise the change in the interaction between CO3 γδ TCR and CD1a mutants with respect to the wild-type CD1a protein (black bar, KD = 24 μM). The values were calculated from at least two independent experiments (n ≥ 2). The error bars correspond to SEM. b Residues involved in the CO3-CD1a complex formation on the surface of CD1a (dark grey)/β2m (blue) are coloured based on the mutation analysis shown in a. Amino acids critical for the recognition (red) by CO3 γδ TCR correspond to the Tyr19-Trp23 loop of CD1a. Source data are provided as a Source Data file.
