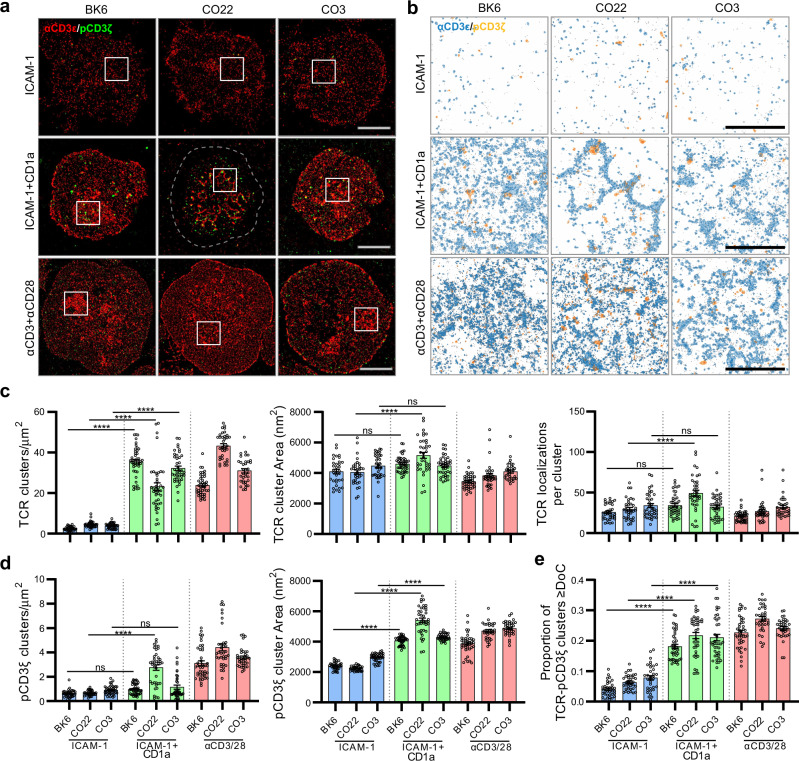
Fig. 7. CD1a-induced γδ TCR clustering and signalling.
a Dual-colour single-molecule localisation microscopy images of CD3ε (red) and pCD3ζ (green) in Jurkat T cells expressing CD1a-reactive BK6, CO22 and CO3 TCRs triggered on supported lipid bilayer decorated with ICAM-1, ICAM-1 + CD1a or anti-CD3/CD28 antibodies under 5 min. Scale bar 5 µm. b Closeup view (4 × 4 µm) of cluster maps generated through DBSCAN analysis based on representative regions (boxed) from the corresponding single-molecule localisation microscopy images. Pseudo coloured CD3ε and pCD3ζ clusters are shown in blue and orange respectively. Localisations outside the threshold of clustered organisation are indicated in black dots. Scale bar 2 µm. c, d CD3ε and pCD3ζ clustering was quantified by DBSCAN analysis and the degree of CD3ε-pCD3ζ colocalisation analysed with DoC thresholding and reported as proportion of colocalised clusters e. Analysis was performed across n ≥ 30 single T cells which includes at least three independent replicates. Statistical significance determined by one-way ANOVA; ns, not significant; *P ≤ 0.05; **P ≤ 0.01; ***P ≤ 0.001; ****P ≤ 0.0001. The exact values of the P values are shown in Supplementary Table 4. Error bars represent the SEM. Source data are provided as a Source Data file.

