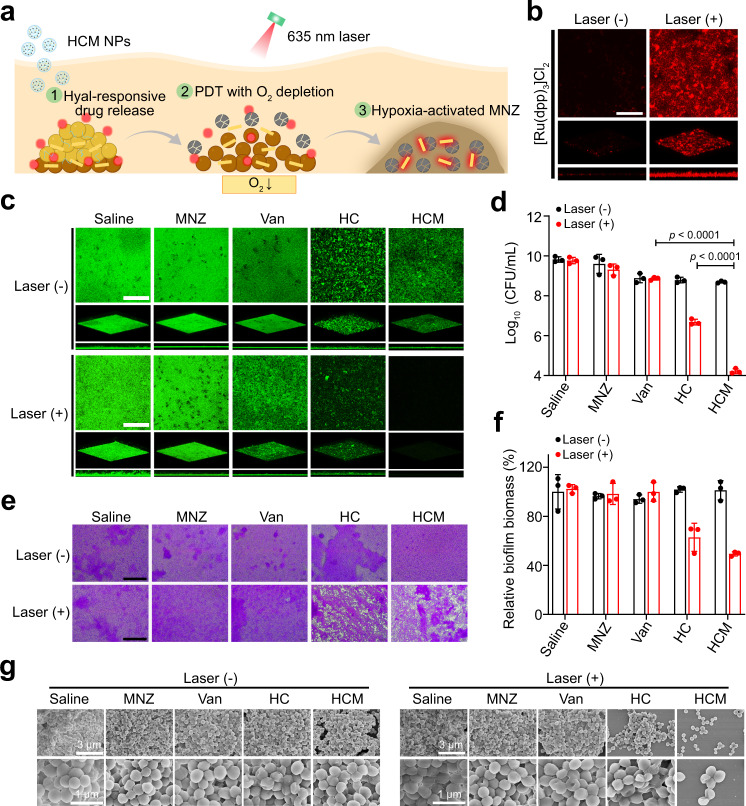
Fig. 4. PDT-activated chemotherapy of MRSA biofilms by hypoxia potentiation.
a Schematic illustration of the PDT-induced hypoxia and subsequent activation of MNZ for enhanced anti-biofilm treatment by HCM NPs. b Three-dimensional (3D) CLSM images of [Ru(dpp)3]Cl2 stained MRSA biofilms with or without PDT (635 nm, 20 mW/cm2, 30 min) by HCM NPs. Scale bar is 200 μm. Size of CLSM images is 630 μm × 630 μm. c 3D CLSM images of MRSA biofilms stained by Calcein-AM (green) after various treatments. Size of CLSM images is 630 μm × 630 μm. Scale bar is 200 μm. d Numbers of viable MRSA within biofilms after various treatments (n = 3 biologically independent samples; mean ± SD). Statistical significance was analyzed via two-way ANOVA test with a Tukey post-hoc test. e Micrographs of MRSA biofilms stained by crystal violet after various treatments. Scale bar is 200 μm. f Relative biofilm biomass of MRSA biofilms after various treatments (n = 3 biologically independent samples; mean ± SD). g Scanning electron microscopy (SEM) images of MRSA biofilms after various treatments. Three independent experiments were performed and representative results are shown in b, c, e, and g. Source data are provided as a Source Data file.

