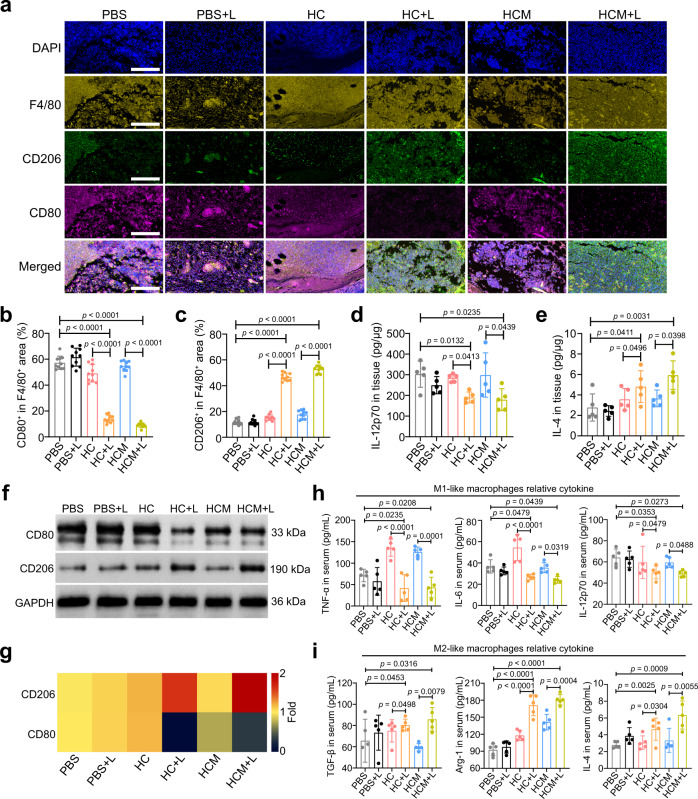
Fig. 6. Macrophage polarization of MRSA biofilm infected mice after PDT-activated chemotherapy.
a Immunofluorescence images of F4/80 (yellow), CD206 (green), and CD80 (violet) in the infected tissues after treatment. Scale bar is 400 μm. Percentage of CD80+ (b) and CD206+ (c) area to total F4/80+ area calculated from the immunofluorescence images (n = 10 biologically independent samples; mean ± SD). Secretion levels of IL-12p70 (d) and IL-4 (e) in the infected tissues after treatment (n = 5 biologically independent samples; mean ± SD). f Expression levels of CD80 and CD206 in the infected tissues determined by western blotting after treatment. g Heat map of the relative expression of CD80 and CD206 in the infected tissues compared to the PBS group calculated from western blotting results. Secretion levels of M1 macrophage-relative cytokines (h) and M2 macrophage-relative cytokines (i) in the serums isolated from mice after treatment (n = 5 biologically independent samples; mean ± SD). All statistical significance was analyzed via one-way ANOVA with a Tukey post-hoc test. Source data are provided as a Source Data file.

