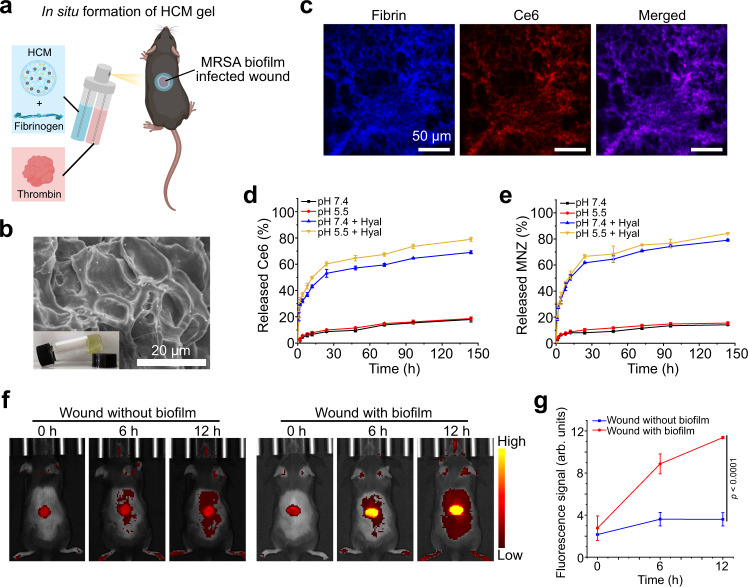
Fig. 7. Preparation and characterization of the HCM gel.
a Schematic illustration of the HCM gel in situ formed on bacterial biofilm infected wounds. b SEM image of the HCM gel. Inset: photograph of HCM gel. c CLSM images of the HCM gel, in which the fibrinogen was labeled with fluorescein isothiocyanate (FITC, blue). Cumulative release profile of Ce6 (d) and MNZ (e) from the HCM gel incubated with or without Hyal under different pH conditions (n = 3 independent samples; mean ± SD). Fluorescence images (f) and fluorescence intensity (g) of normal wounds and wounds with MRSA biofilm infection in diabetic mice after treatment with HCM gel at different time points (n = 3 biologically independent animals from f; mean ± SD). Statistical significance was analyzed via one-way ANOVA with a Tukey post-hoc test. Three independent experiments were performed and representative results are shown in b and c. Source data are provided as a Source Data file.

