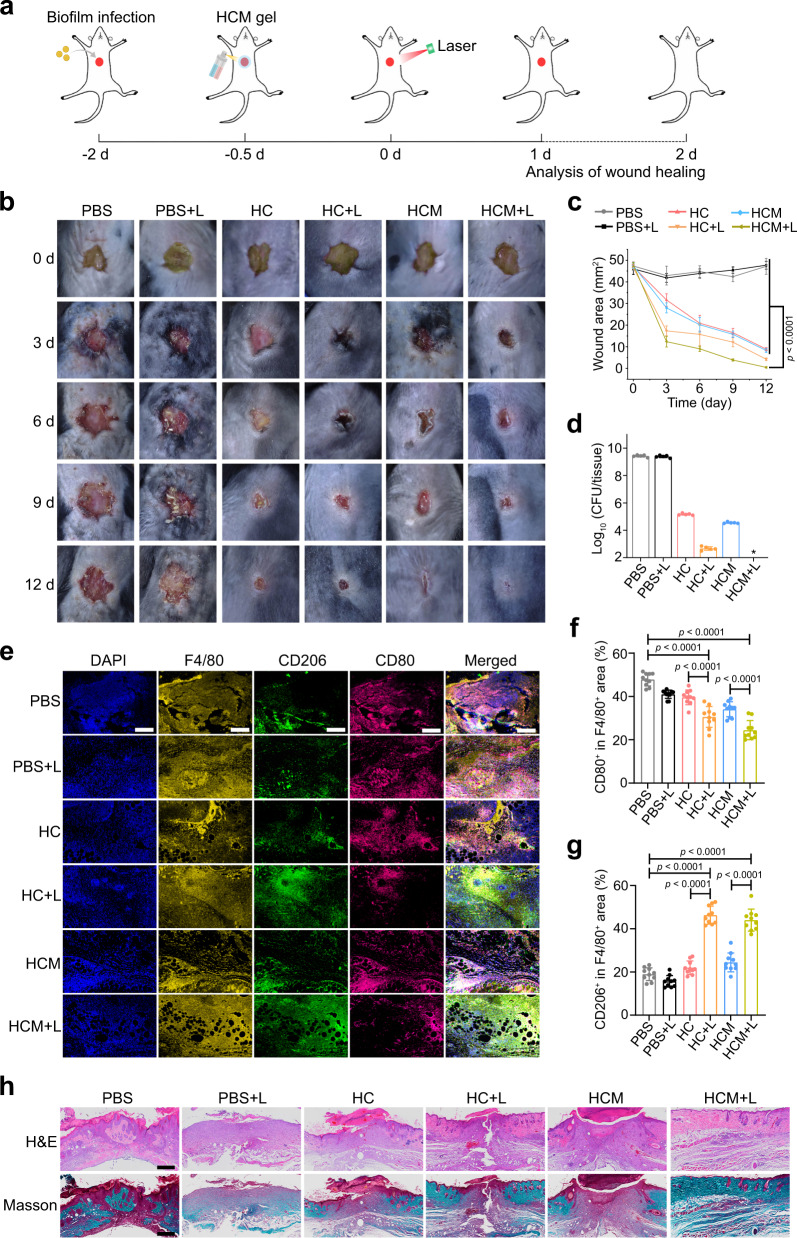
Fig. 8. Treatment of MRSA biofilm infected wounds in diabetic mice by HCM gel.
a Schematic illustration of the experimental procedure. Photographs (b) and wound area (c) of the infected wounds after treatment (n = 5 biologically independent samples; mean ± SD). d Colony numbers of bacteria in infected wounds at 12 d post-treatment (n = 5 biologically independent samples; mean ± SD). e Immunofluorescence images of F4/80 (yellow), CD206 (green), and CD80 (violet) in infected wounds at 4th d post-treatment. Scale bar is 200 μm. Percentage of CD80+ (f) and CD206+ (g) area in F4/80+ area calculated from immunofluorescence images (n = 10 biologically independent samples; mean ± SD). h H&E and Masson’s trichrome-stained images of infected tissues at 12 d post-treatment. Scale bar is 500 μm. Statistical significance was analyzed via one-way ANOVA with a Tukey post-hoc test. Source data are provided as a Source Data file.

