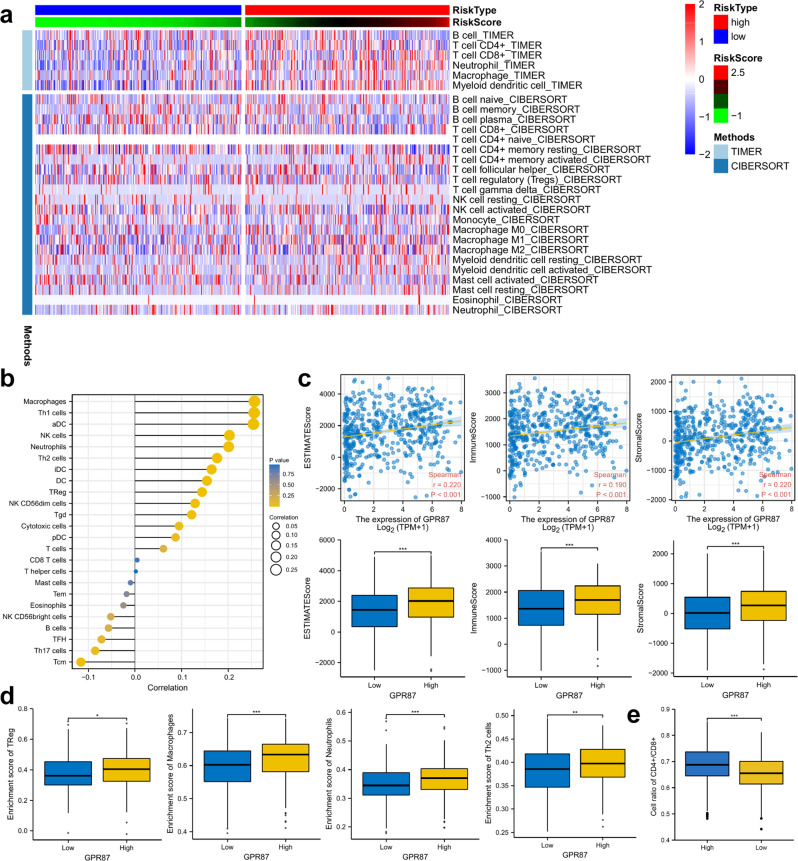
Fig. 6. The relationship between GPR87 expression and immune cell infiltration.
a Heat map demonstrating the level of immune cell infiltration in patients with high and low GPR87 expression, with immune cell infiltration evaluated by TIMER and CIBERSORT algorithms. b Lollipop graph shows the correlation between GPR87 expression and immune cells. c GPR87 was analyzed in correlation with immune scores and stromal scores, and differences in immune scores and stromal scores were analyzed in patients with high and low expression of GPR87. The immune scores and stromal scores were calculated by the ESTIMATE algorithm. d Differential analysis of regulatory T cells, macrophages, neutrophils, and T helper 2 cells in patients with high and low expression of GPR87. e Analysis of differences in CD4+/CD8+ cell ratios between patients with high and low expression of GPR87.

