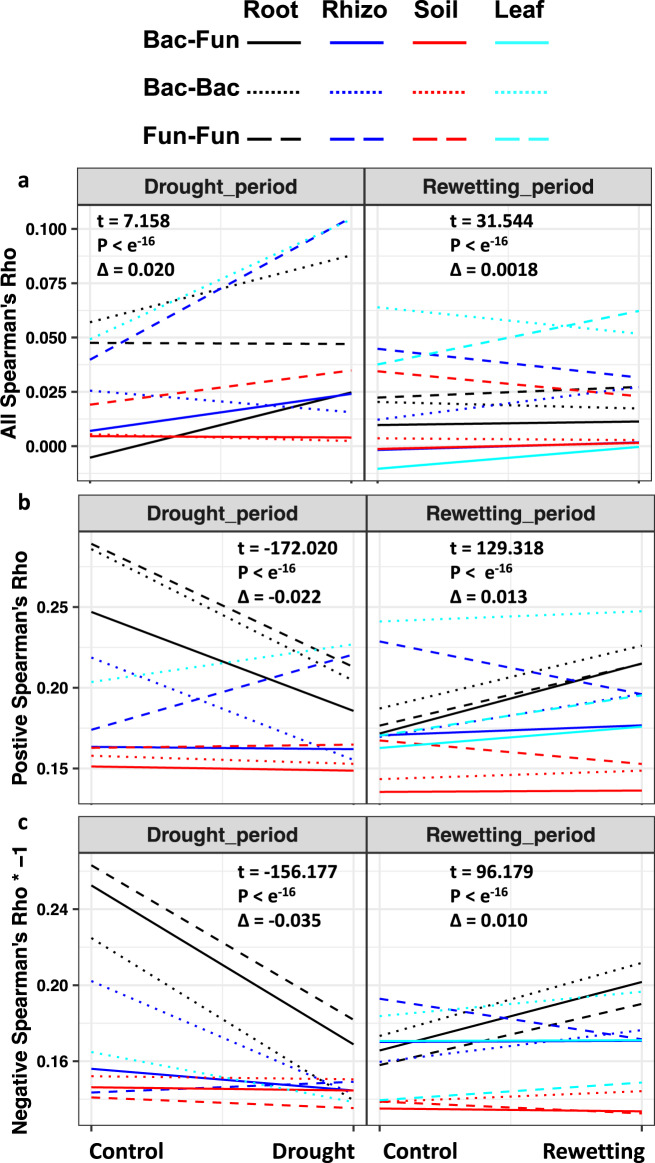
Fig. 2. Correlations of microbes in drought stress and drought relief.
Estimates of combined correlations (row a) show an increase in positive correlations under drought stress across the four compartments (root, black; rhizosphere, blue; soil, red; leaf, green). Data points underlying the lines in the figure are provided in the alternative version in Supplementary Fig. 2. This result is in line with the stress gradient hypothesis which posits that stressful environments favor positive associations because competition will be less intense than in benign environments32,33,36,37. Note that positive trends in combined correlations can arise in two ways. First, from an increase of positive correlations (row b) that exceeds the rise in negative correlations (row c), e.g., Leaf bacterial-bacterial (Bac-Bac) correlations or rhizosphere fungal-fungal (Fun-Fun) correlations in the drought period (Negative correlations in row C values are multiplied by −1 to facilitate comparison). Second, from a decrease in negative correlations that exceeds a decrease in positive correlations, e.g., root bacterial-bacterial correlations or root bacterial-fungal (Bac-Fun) correlations in drought. Combined (a), positive (b) and negative (c) estimates of correlation (Spearman’s rho, ρ) are given for four compartments (root, rhizosphere, soil and leaf), and three types of correlations (Bacterium-Bacterium, Fungus-Fungus, Bacterium-Fungus). T-tests (two sided) were carried out for linear mixed effect modelling that incorporates link type and compartments as random factors. Detailed distribution densities of correlations are presented in Supplementary Fig. 3. Source data are provided as a Source Data file.

