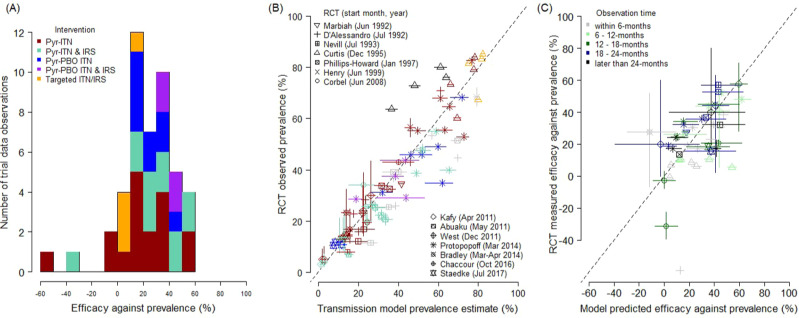
Fig. 2. Differences in the epidemiological impact of insecticide-treated nets (ITNs) and the residual spraying of insecticides indoors (IRS) as evaluated in cluster-randomised control trials (RCTs) and predicted by a entomological data.
A Trial observed relative (to respective control arms as noted in Fig. 1, and Materials and Methods) efficacy against prevalence estimated for 46 data observations (Supplementary Data S1.8). Bar colours indicate the different types of intervention examined. B Comparison between observed trial prevalence and prevalence predicted by the transmission dynamics model parameterised using entomological data (matching diagnostic method and cohort characteristics, Supplementary Data S1.7, best-fitting parameters shown; Supplementary Table 3, column 4) for 13 RCTs, with symbols identifying principal investigators listed with the start date of the trial, that reported a total of 73 prevalence cross-sectional surveys. Colours indicate the type of intervention in the trial arm: pyrethroid-only nets (red), pyrethroid-PBO nets (blue), pyrethroid-only nets and IRS (green), pyrethroid-PBO nets and IRS (purple), or IRS only (orange). C Comparison of observed efficacy estimates and those predicted by the model (Supplement Data S8). In C, colours denote the length of time in months since the deployment of interventions when the prevalence observation was made that was used to estimate efficacy. Individual model predictions for each study are given in Supplementary Figs. S3–S15 with equivalent figures for alternative methods of combing data shown in Supplementary Fig. S18. Vertical and horizontal solid lines around point estimates (mean) for either observed or predicted data indicate 95% uncertainty from intervention performance, while dashed black line in B and C show the equivalence line. Uncertainty estimates for the observed data found in Supplementary Data S1.3 and for the different models in Supplementary Data S1.7 and 1.8 for B and C, respectively.

