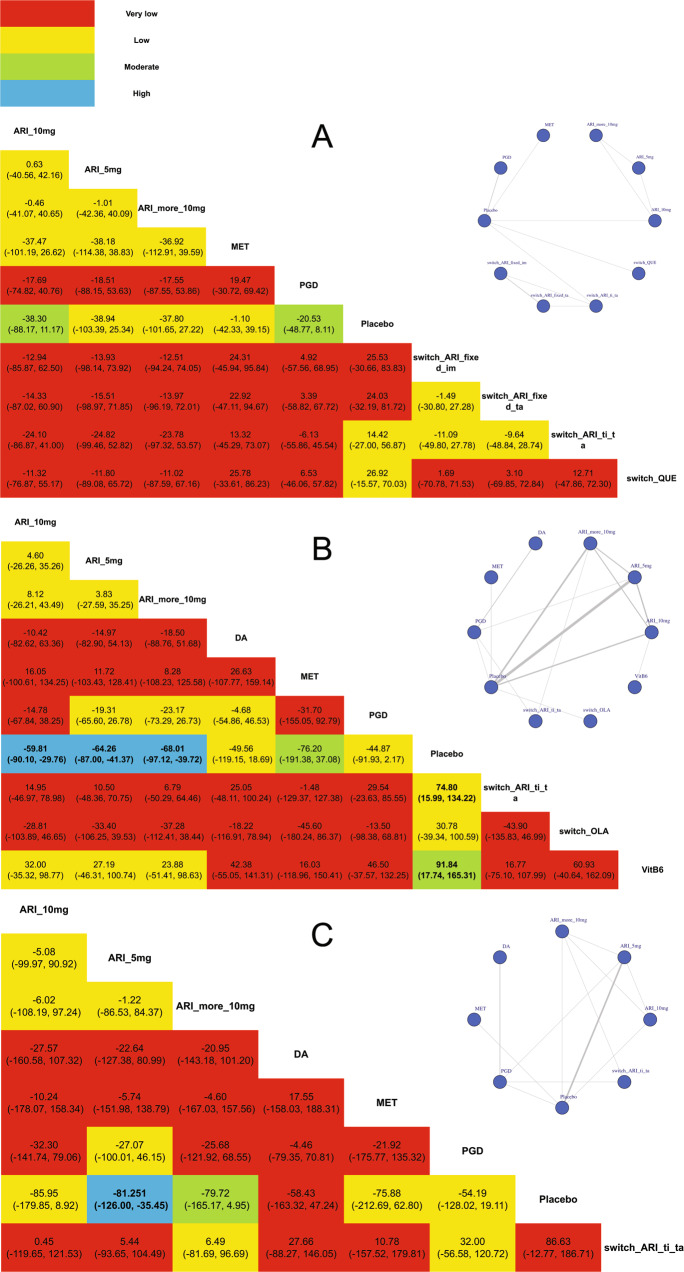
Fig. 4. Subgroup analyses of network meta-analysis.
A Network plot and league table of comparison of pharmacological treatment strategies in treatment of patients with antipsychotic-induced hyperprolactinemia less than 50 ng/ml; B network plot and league table of comparison of pharmacological treatment strategies in treatment of patients with antipsychotic-induced hyperprolactinemia more than 50 ng/ml; C network plot and league table of comparison of pharmacological treatment strategies in treatment of patients with antipsychotic-induced hyperprolactinemia more than 100 ng/ml. ARI_5 mg adjunctive 5 mg aripiprazole, ARI_10 mg adjunctive 10 mg aripiprazole, ARI_more_10 mg adjunctive more than 10 mg aripiprazole, MET adjunctive metformin, PGD adjunctive Peony-Glycyrrhiza decoction, switch_ARI_fixed_im switching to ARI with fixed dosage and reducing the previous antipsychotic immediately, switch_ARI_fixed_ta switching to ARI with fixed dosage and reducing the previous antipsychotic in tardation, switch_ARI_ti_ta switching to ARI in titration and reducing the previous antipsychotic in tardation, VitB6 adjunctive high-dose vitamin B6. The color of each cell indicates the certainty of evidence according to the Grading of Recommendations Assessment, Development, and Evaluation. Red color refers to very low certainty of evidence, yellow color refers to low certainty of evidence, green color refers to moderate certainty of evidence, blue color refers to high certainty of evidence. The significant outcomes were shown in bold.

