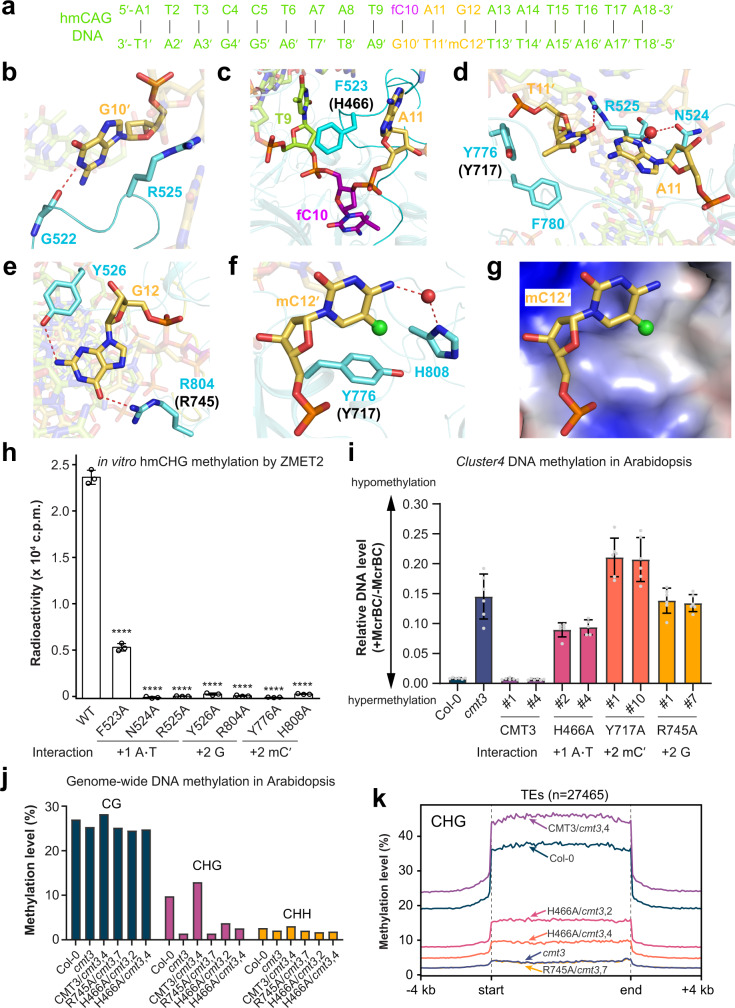
Fig. 2. Base-specific interaction between ZMET2/CMT3 and hmCHG site.
a DNA sequence used for structural study. b–f Close-up view of the ZMET2-DNA interactions at the orphan G10′ site (b), DNA cavity vacated by base flipping (c), +1-flanking A11·T11′ pair (d), +2-flanking G12 (e), and +2-flanking mC12′ (f). The corresponding DNA-binding residues in CMT3 mutated for in vivo analysis are labeled in parenthesis. g The hydrophobic concave of ZMET2 harboring mC12′. The 5-methyl group is shown as a green sphere. h In vitro DNA methylation assay of ZMET2, wild-type (WT) and mutant, on substrate containing single hmCHG site. Data are mean ± s.d. (n = 3 biological replicates). Statistical analysis for WT vs mutants used two-tailed Student’s t test. ****, p < 0.0001. The roles of individual mutation sites in substrate recognition are denoted. i DNA methylation of the Cluster4 locus in Arabidopsis measured by McrBC-qPCR assay. WT or mutant CMT3 was expressed in cmt3 mutant background. Two independent experiments for WT or mutant CMT3 were performed, with each shown as a separate column. For each column, data are mean ± s.d. (n = 6 technical replicates). The number labels denote individual transgenic lines. j Bar charts showing whole-genome DNA methylation level of WT and mutant CMT3 transgenic plants in cmt3 mutant background. k Metaplots of CHG methylation overall TEs in Arabidopsis genome in the same set of transgenic plants in j. Source data are provided as a Source Data file.

