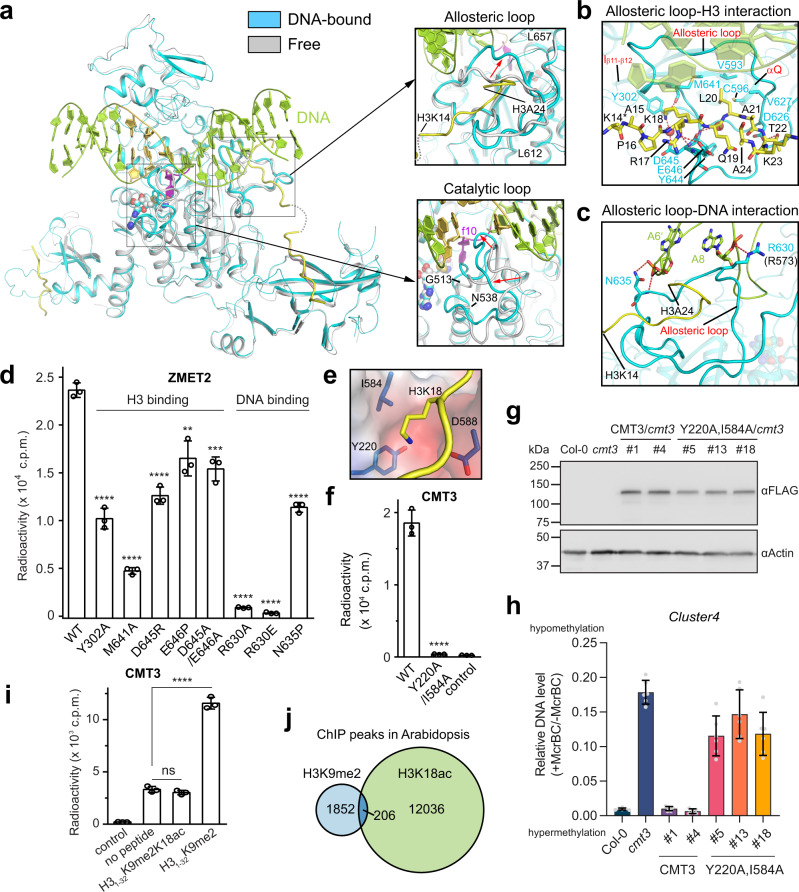
Fig. 3. Structural basis for ZMET2/CMT3 activation by H3K9me2/H3K18 binding.
a Structural overlay of the ternary ZMET2-hmCAG-H31–32Kc9me2 complex and the binary ZMET2-H31–32K9me2 complex (PDB 4FT4), with DNA-free ZMET2 and H3K9me2 peptide colored in gray and light pink, respectively. The allosteric loop and catalytic loop displaying the most pronounced conformational changes (indicated by the red arrow) are highlighted in the expanded views. b Close-up view of the interaction between ZMET2 and the C-terminal segment (residues 14–23) of H31–32K9me2. The hydrogen bonds are depicted as dashed lines. The water molecules are shown as red spheres. The side chain of H3 K14 is not modeled due to the lack of electron density, indicated by an asterisk. c Close-up view of the interaction between the allosteric loop and DNA. d In vitro DNA methylation assay of ZMET2, WT, and mutants, on the hmCHG DNA containing a single CAG/mCTG site. The role of each mutation site in DNA or histone recognition is denoted on top. Data are mean ± s.d. (n = 3 biological replicates). e Electrostatic surface of the H3 K18-binding pocket in the structural model of the CMT3-H3Kc9me2-hmCAG complex. f In vitro DNA methylation assay of WT or Y220A/I584A-mutated CMT3 on the DNA containing multiple hmCHG sites. Data are mean ± s.d. (n = 3 biological replicates). g Immunoblots showing the WT and Y220A/I584A mutant CMT3 protein level in cmt3 background. h DNA methylation of Cluster4 locus in Arabidopsis transgenic plants in cmt3 background measured by McrBC-qPCR assay. 10-d-old seedlings were used. Two independent experiments were performed for WT and mutant CMT3, with each shown as a separate column. For each column, data are mean ± s.d. (n = 6 technical replicates). i In vitro DNA methylation assay of CMT3 on the DNA containing multiple hmCHG sites, in the presence or absence of H31–32K9me2 or H31–32K9me2K18ac peptide. Data are mean ± s.d. (n = 3 biological replicates). j Venn diagram showing the overlap between H3K9me2 and H3K18ac ChIP-seq peaks. The H3K9me2 and H3K18ac ChIP-seq data were from27,28, respectively. Statistical analysis used two-tailed Student’s t test. ns, not significant; **p < 0.01; ***p < 0.001; ****p < 0.0001. Source data are provided as a Source Data file.

