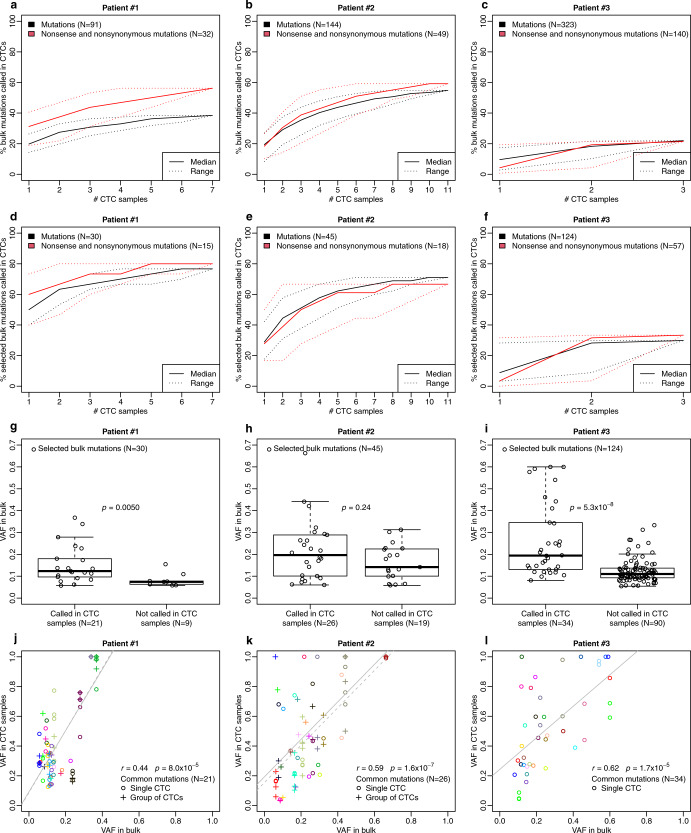
Fig. 1. Comparison between single-nucleotide variation (SNVs) detected in bulk tumor and in CTCs.
a–c Percentage of bulk mutations called in CTCs, in patient #1, #2, and #3, respectively. Mutations in bulk and CTCs were independently called using the Strelka algorithm. The solid lines are the median, the dotted lines the range. Black: All mutations. Red: Nonsense and nonsynonymous mutations. d–f Percentage of selected bulk mutations called in CTCs, in patient #1, #2 and #3, respectively. Selected bulk mutations are defined as bulk mutations with 20X coverage in at least one CTC. Mutations in bulk and CTCs were independently called using the Strelka algorithm. The solid lines are the median, the dotted lines the range. Black: All mutations. Red: Nonsense and nonsynonymous mutations. g–i Distribution of the VAFs of selected bulk mutations according to whether they are called or not in CTC samples. Selected bulk mutations are defined as bulk mutations with 20× coverage in at least one CTC and are represented as black circles. Mutations in bulk and CTCs were independently called using the Strelka algorithm. P-value (two-sided) compares the distribution of the VAFs of selected bulk mutations in the two groups (called vs. not called in CTCs) using a Wilcoxon test. j–l Spearman correlation (r) between VAF in bulk and VAF in CTCs, for selected bulk mutations called in CTC samples (common mutations), in patient #1, #2, and #3, respectively. Each color represents a specific mutation. Single CTC samples are represented as circles (o) and group of CTC samples as crosses (+).

