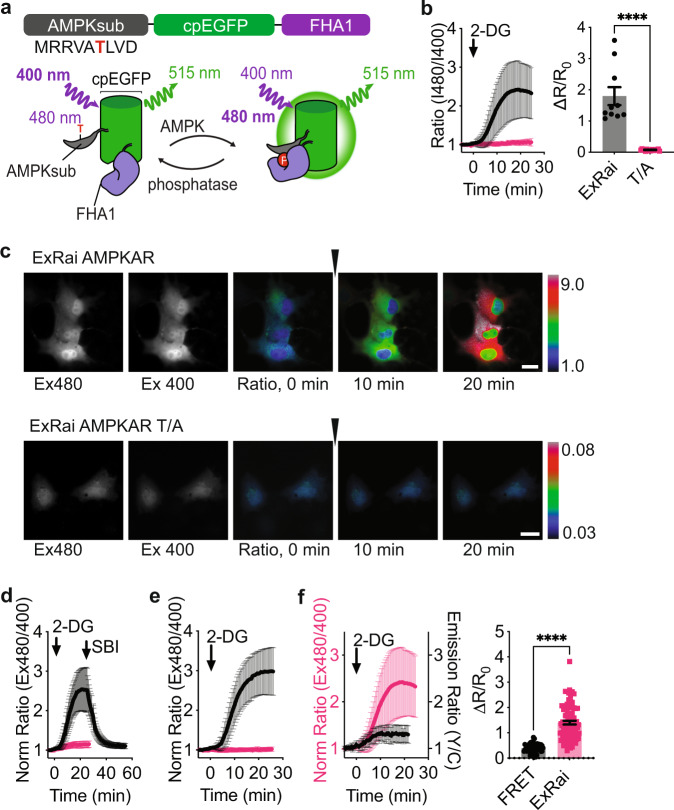
Fig. 1. Development and characterization of ExRai AMPKAR.
a Design and domain structure of ExRai AMPKAR. Threonine phosphorylated by AMPK denoted in red. b Average response of ExRai AMPKAR (black, n = 10 cells from three experiments), and ExRai AMPKAR T/A (pink, n = 17 cells from three experiments) to 2-DG (40 mM) stimulation in Cos7 cells along with maximum ratio change (****p = 3.05 × 10⁻⁸, unpaired t-test, two-tailed). c Representative images of ExRai AMPKAR (top) and ExRai AMPKAR T/A (bottom) in Cos7 cells treated with 2-DG (40 mM) at the indicated time. d Average response of ExRai AMPKAR to AMPK stimulation by 2-DG (40 mM) followed by SBI-0206965 (SBI, 30 µM, black, n = 35 cells from three experiments) or after pretreatment with SBI-0206965 in HEK293T cells (pink, n = 43 cells from four experiments). e Average response of ExRai AMPKAR in WT MEFs (black, n = 31 cells from four experiments) and AMPKα KO MEFs (pink, n = 23 cells from four experiments) treated with 2-DG (40 mM). f Response of ExRai AMPKAR (pink, n = 90 cells from five experiments) and FRET-based AMPK reporter ABKAR (black trace, n = 25 cells from two experiments) in HEK293T cells treated with 2-DG (40 mM), along with maximum ratio change (****p = 4.31 × 10⁻¹⁹, unpaired t-test, two-tailed). For all figures, time courses show the mean ± SD, dot plots show the mean ± SEM. Scale bars, 20 µm.

