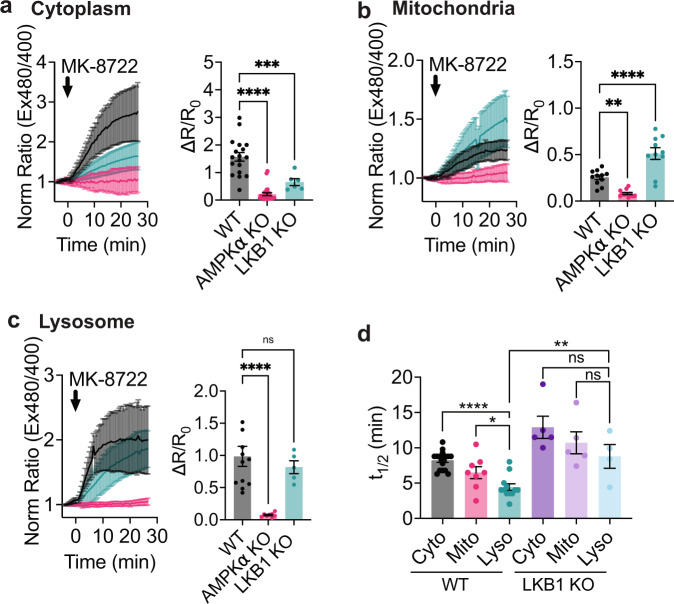
Fig. 3. AMPK activity induced by MK-8722 exhibits distinct spatiotemporal dynamics.
a Average response of ExRai AMPKAR in WT (black, n = 18 cells from three experiments), AMPKα KO (pink, n = 25 cells from three experiments), and LKB1 KO MEFs (teal, n = 6 cells from four experiments) treated with MK-8722 (500 nM) along with maximum ratio change (***p = 0.002, ****p < 1 × 10⁻¹⁰, one-way ANOVA with Dunnett’s multiple comparisons test). b Average response of mito-ExRai AMPKAR in WT (black, n = 11 cells from four experiments), AMPKα KO (pink, n = 11 cells from three experiments), and LKB1 KO MEFs (teal, n = 10 cells from five experiments) treated with MK-8722 (500 nM) along with maximum ratio change (**p = 0.0048, ****p = 9.76 × 10⁻⁵, one-way ANOVA with Dunnett’s multiple comparisons test). c Average response of lyso-ExRai AMPKAR in WT (black, n = 12 cells from three experiments), AMPKα KO (pink, n = 8 cells from three experiments) and LKB1 KO MEFs (teal, n = 5 cells from four experiments) to MK-8722 (500 nM) stimulation, along with maximum ratio change (ns = 0.66, ***p < 0.0001, one-way ANOVA with Dunnett’s multiple comparisons test). d t1/2 of cytoplasmic ExRai AMPKAR (black, n = 19 cells from three experiments), mito-ExRai AMPKAR (pink, n = 11 cells from four experiments), and lyso-ExRai AMPKAR (teal, n = 12 cells from three experiments) expressed in WT MEFs, and cytoplasmic ExRai AMPKAR (dark purple, n = 5 cells from four experiments), mito-ExRai AMPKAR (light purple, n = 5 cells from five experiments), and lyso-ExRai AMPKAR (light blue, n = 5 cells from four experiments) expressed in LKB1 KO MEFs following treatment with MK-8722 (*p = 0.0203; ****p = 1.47 × 10⁻⁶, ns ≥0.18, one-way ANOVA with Dunnett’s multiple comparisons test, **p = 0.0031, unpaired t-test, two-tailed). For all figures, time courses show the mean ± SD, dot plots show the mean ± SEM.

