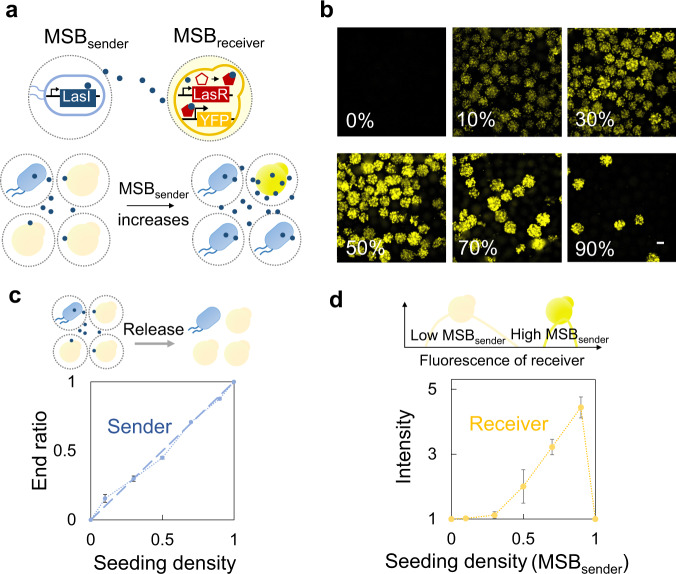
Fig. 6. MSBC platform enabled communication across the species.
a Schematic shows that MSBC platform could modulate the communication across the species. We programmed the E. coli to express 3-oxo-C12-HSL (3OC12) under induction and generated the MSBsender. We programed the S. cerevisiae with a circuit bearing the corresponding inducible allosteric transcription factors (VP16-LasR), and generated the MSBreceiver. The signals (3OC12) of MSBsender diffused across the cell membranes and polymeric capsules, and were sensed by the MSBreceiver to drive the expression of the YFP. MSBC could tightly module the signal intensity. A higher MSBsender seeding density led to an increased concentration of signaling molecules, which triggered a stronger expression of YFP of MSBreceiver. b Increasing the seeding density of MSBsender gradually lighted up the MSBreceiver. MSBsender and MSBreceiver were co-cultured with different seeding ratios (~2000 MSBs in total) into the medium (1 mL LB+SC). The number on the images indicated the seeding density of MSBsender (). The resultant MSBC were all cultured at 30 °C for 24 h. There were hardly any YFP signals in the absence of MSBsender. Increasing the MSBsender density gradually lighted up the MSBreceiver because of the increased concentration of signaling molecules (3OC12). Scale bar = 200 μm. c Quantification results reflected that MSBC strategy precisely modulated the composition of consortia. The cells of MSBC were released from the polymeric capsules and counted by the flow cytometry measurement. The x axis indicated the seeding density of MSBsender. Error bars = standard deviation (n = 3 biologically independent samples). d Quantification results reflected that MSBC strategy tightly modulated the signal intensity. Cells were released from the MSBC. YFP intensity was quantified through the flow cytometry (the median of the population) and normalized by the value when seeding density of MSBsender equals to 0. The x axis indicated the seeding density of MSBsender. Error bars = standard deviation (n = 3 biologically independent samples). Source data are provided as a Source Data file.

