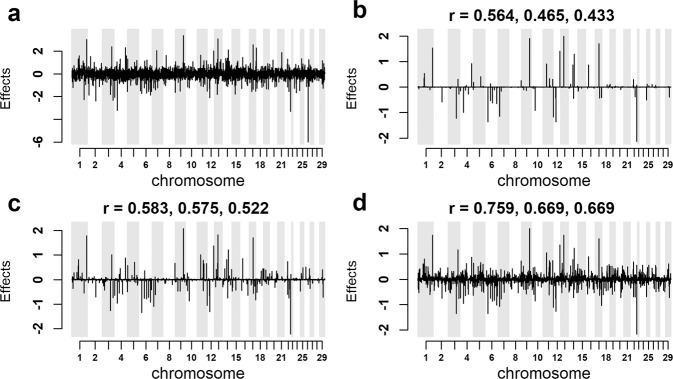
Fig. 4. The true SNP effects for the 4000 simulated causal variants and their estimated effects using the H30 training data set, embedded within three different genotype densities.
All results are from BR3 using five chains, each of length 2,000 and with a block size of 25. The r values above panels b–d, are all Pearson’s correlation values. The first value above each of these figures is the correlation between estimated and true breeding values, the 2nd value is the correlation between the true 4000 causal SNP effect values to their corresponding estimates, while the 3rd value is the estimated SNP effects correlation across all SNPs within each of the analysis to their simulated true values: a the simulated true effects for the 4,000 causal variants. b the effects of the 4000 causal variants estimated in the training set with 400,000 marker genotypes. c the effects recovered from the training set with 40,000 SNP genotypes. d the effects recovered when only the true simulated causal variants were used as the genotype set.

