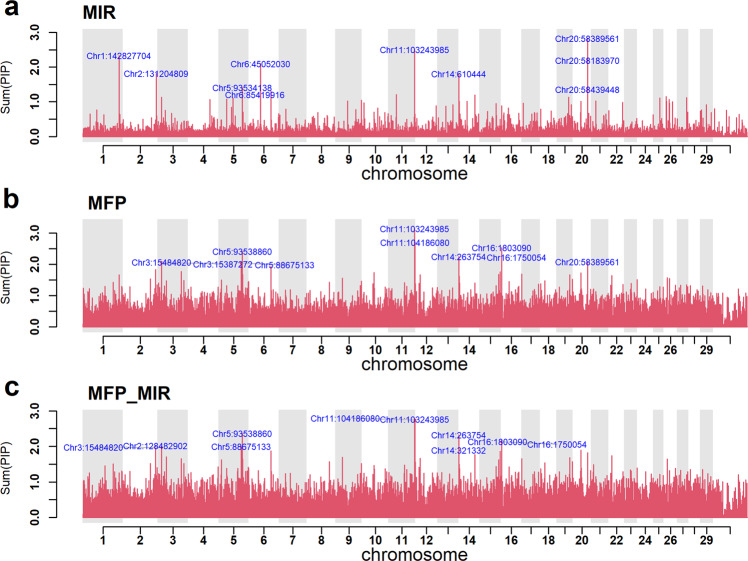
Fig. 8. Manhattan plots for MFP, MIR, and MFP_MIR multi-trait analysis. Y-axis is the sum of the posterior probabilities that SNPs within and centred on each non-overlapping 50 kb segment of the genome is included in the model.
a Result from the 17 PCA MIR multi-trait analysis. b Plot is multi-trait milk, fat, and protein yields. c Multi-trait milk, fat, and protein yield analysis, using BayesR3C, where class 1 was formed from the top 1000 SNPs identified from the MIR analysis. Note each plot has the top 10 SNP effects labelled.

