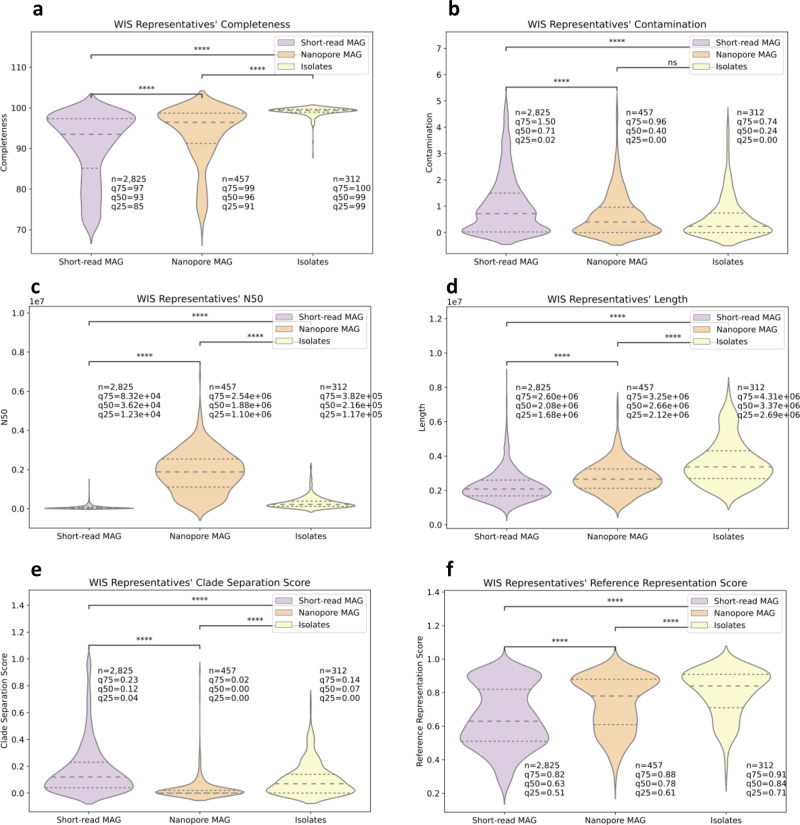
Fig. 4. Nanopore and isolates representative genomes show higher-quality measures than those of short-read-based MAG.
Short-read metagenome-assembled genome (MAG) (n = 2825 genomes) in purple, nanopore MAG (n = 457) in orange and isolates (n = 312) in yellow. a–f are violin plots of the completeness, contamination, N50, length, CSS, and RRS of the representatives genomes, respectively. In each plot, the y axis is the parameter value and drawing width is the kernel density estimate. The dashed line is the median and the dotted lines are the interquartile range. Bonferroni corrected P value annotations: not significant (ns) q > 0.05, *q < 0.05, **q < 0.01, ***q < 0.001, ****q < 0.0001 according to Mann–Whitney U test. Panels b, c, and e seemingly have values under zero, this is a graphical illusion of violin plots since the distribution is dense around the minimal value (zero).

