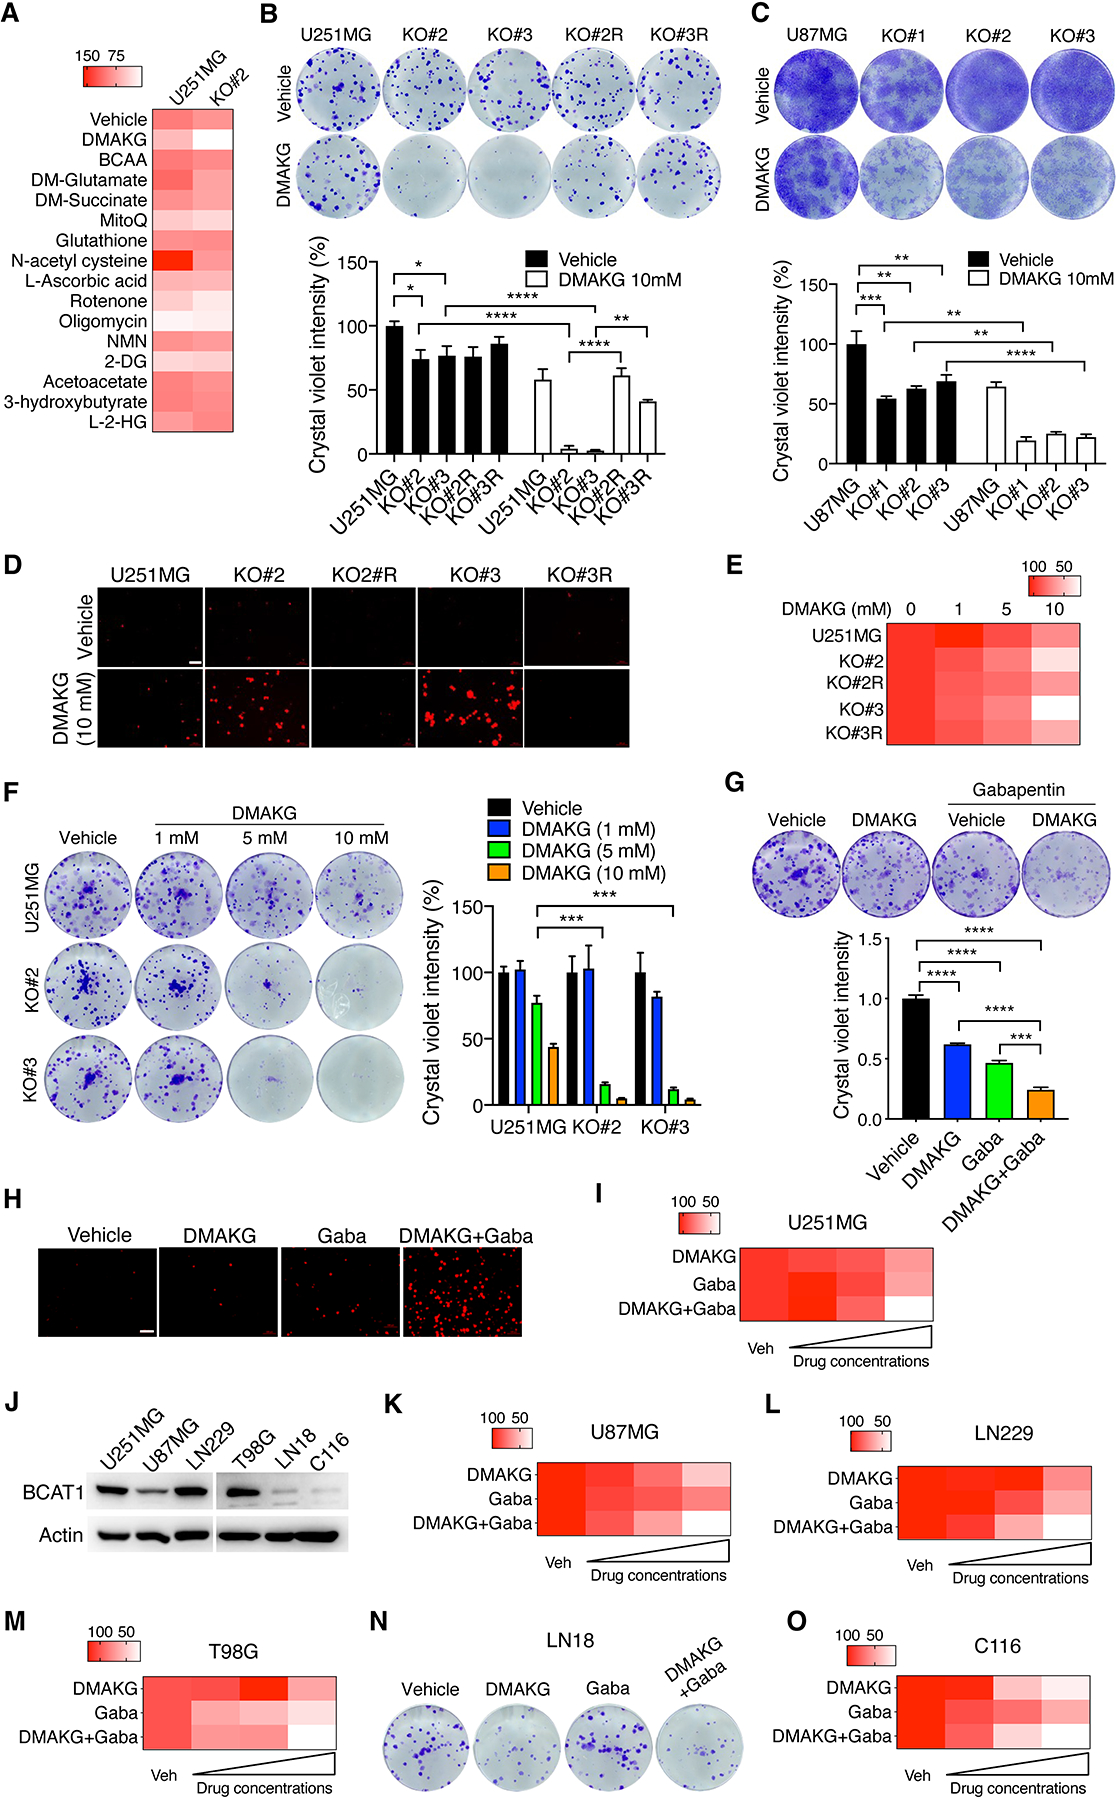
Figure 1. Identification of AKG as a lethal metabolite in IDHWT GBM cells when combined with BCAT1i.

(A) A metabolic screen in parental and BCAT1 KO#2 U251MG cells. The mean percentage of colony growth was normalized to the U251MG-vehicle group and indicated by the gradient color (n = 3–9). (B) Clonogenic assay in parental, BCAT1 KO#2 or KO#3 and BCAT1 rescue (R) U251MG cells treated with vehicle or DMAKG for 7 days. Representative images are shown at the top. The intensity of crystal violet is quantified at the bottom (mean ± SEM, n = 3–6). *p < 0.05; **p < 0.01; ****p < 0.0001 by two-way ANOVA with Tukey’s test. (C) Clonogenic assay in parental and BCAT1 KO#1–3 U87MG cells treated with vehicle or DMAKG for 12 days. Representative images are shown at the top. The intensity of crystal violet is quantified at the bottom (mean ± SEM, n = 3). **p < 0.01; ***p < 0.001; ****p < 0.0001 by two-way ANOVA with Sidak’s test. (D) Parental, BCAT1 KO and BCAT1 rescue (R) U251MG cells treated with vehicle or DMAKG (10 mM) for 48 hours and stained propidium iodide for 10 min. Representative images from three independent experiments are shown. Scale bar, 100 μm. (E) Cell viability assay in parental, BCAT1 KO#2 or KO#3 and BCAT1 rescue (R) U251MG cells treated with vehicle or DMAKG for 48 hours. The mean percentage of cell viability was normalized to the U251MG-vehicle group and indicated by the gradient color (n = 3). (F) Clonogenic assay in parental and BCAT1 KO#2 or KO#3 U251MG cells treated with vehicle or DMAKG for 7 days. Representative images are shown at the left. The intensity of crystal violet is quantified and normalized to U251MG-vehicle at the right (mean ± SEM, n = 3). ***p < 0.001 by two-way ANOVA with Tukey’s test. (G) Clonogenic assay in U251MG cells treated with vehicle, DMAKG (10 mM), gabapentin (Gaba, 5 mM), or both for 7 days. Representative images are shown at the top. The intensity of crystal violet is quantified and normalized to vehicle at the bottom (mean ± SEM, n = 3). ***p < 0.001; ****p < 0.0001 by one-way ANOVA with Dunnett’s test. (H) U251MG cells were treated with vehicle, DMAKG (10 mM), Gaba (20 mM), or both for 48 hours and stained propidium iodide for 10 min. Representative images from three independent experiments are shown. Scale bar, 100 μm. (I) Cell viability assay in U251MG cells treated with vehicle, DMAKG (1, 5, 10 mM), Gaba (5, 10, 20 mM), or both for 48 hours. The mean percentage of cell viability was normalized to the vehicle group and indicated by the gradient color (n = 3). (J) Immunoblot analysis of BCAT1 in a panel of IDHWT GBM cell lines. (K-M, O) Cell viability assay in cells treated with vehicle, DMAKG (1, 5, 10 mM), Gaba (5, 10, 20 mM), or both for 48 hours. The mean percentage of cell viability was normalized to the vehicle group and indicated by the gradient color (n = 3). (N) Clonogenic assay in LN18 cells treated with vehicle, DMAKG (10 mM), Gaba (20 mM), or both for 7 days. Representative images from three independent experiments are shown.
