
Figure 3. BCAT1i/AKG-induced IDHWT GBM cell death is rescued by BCKAs.
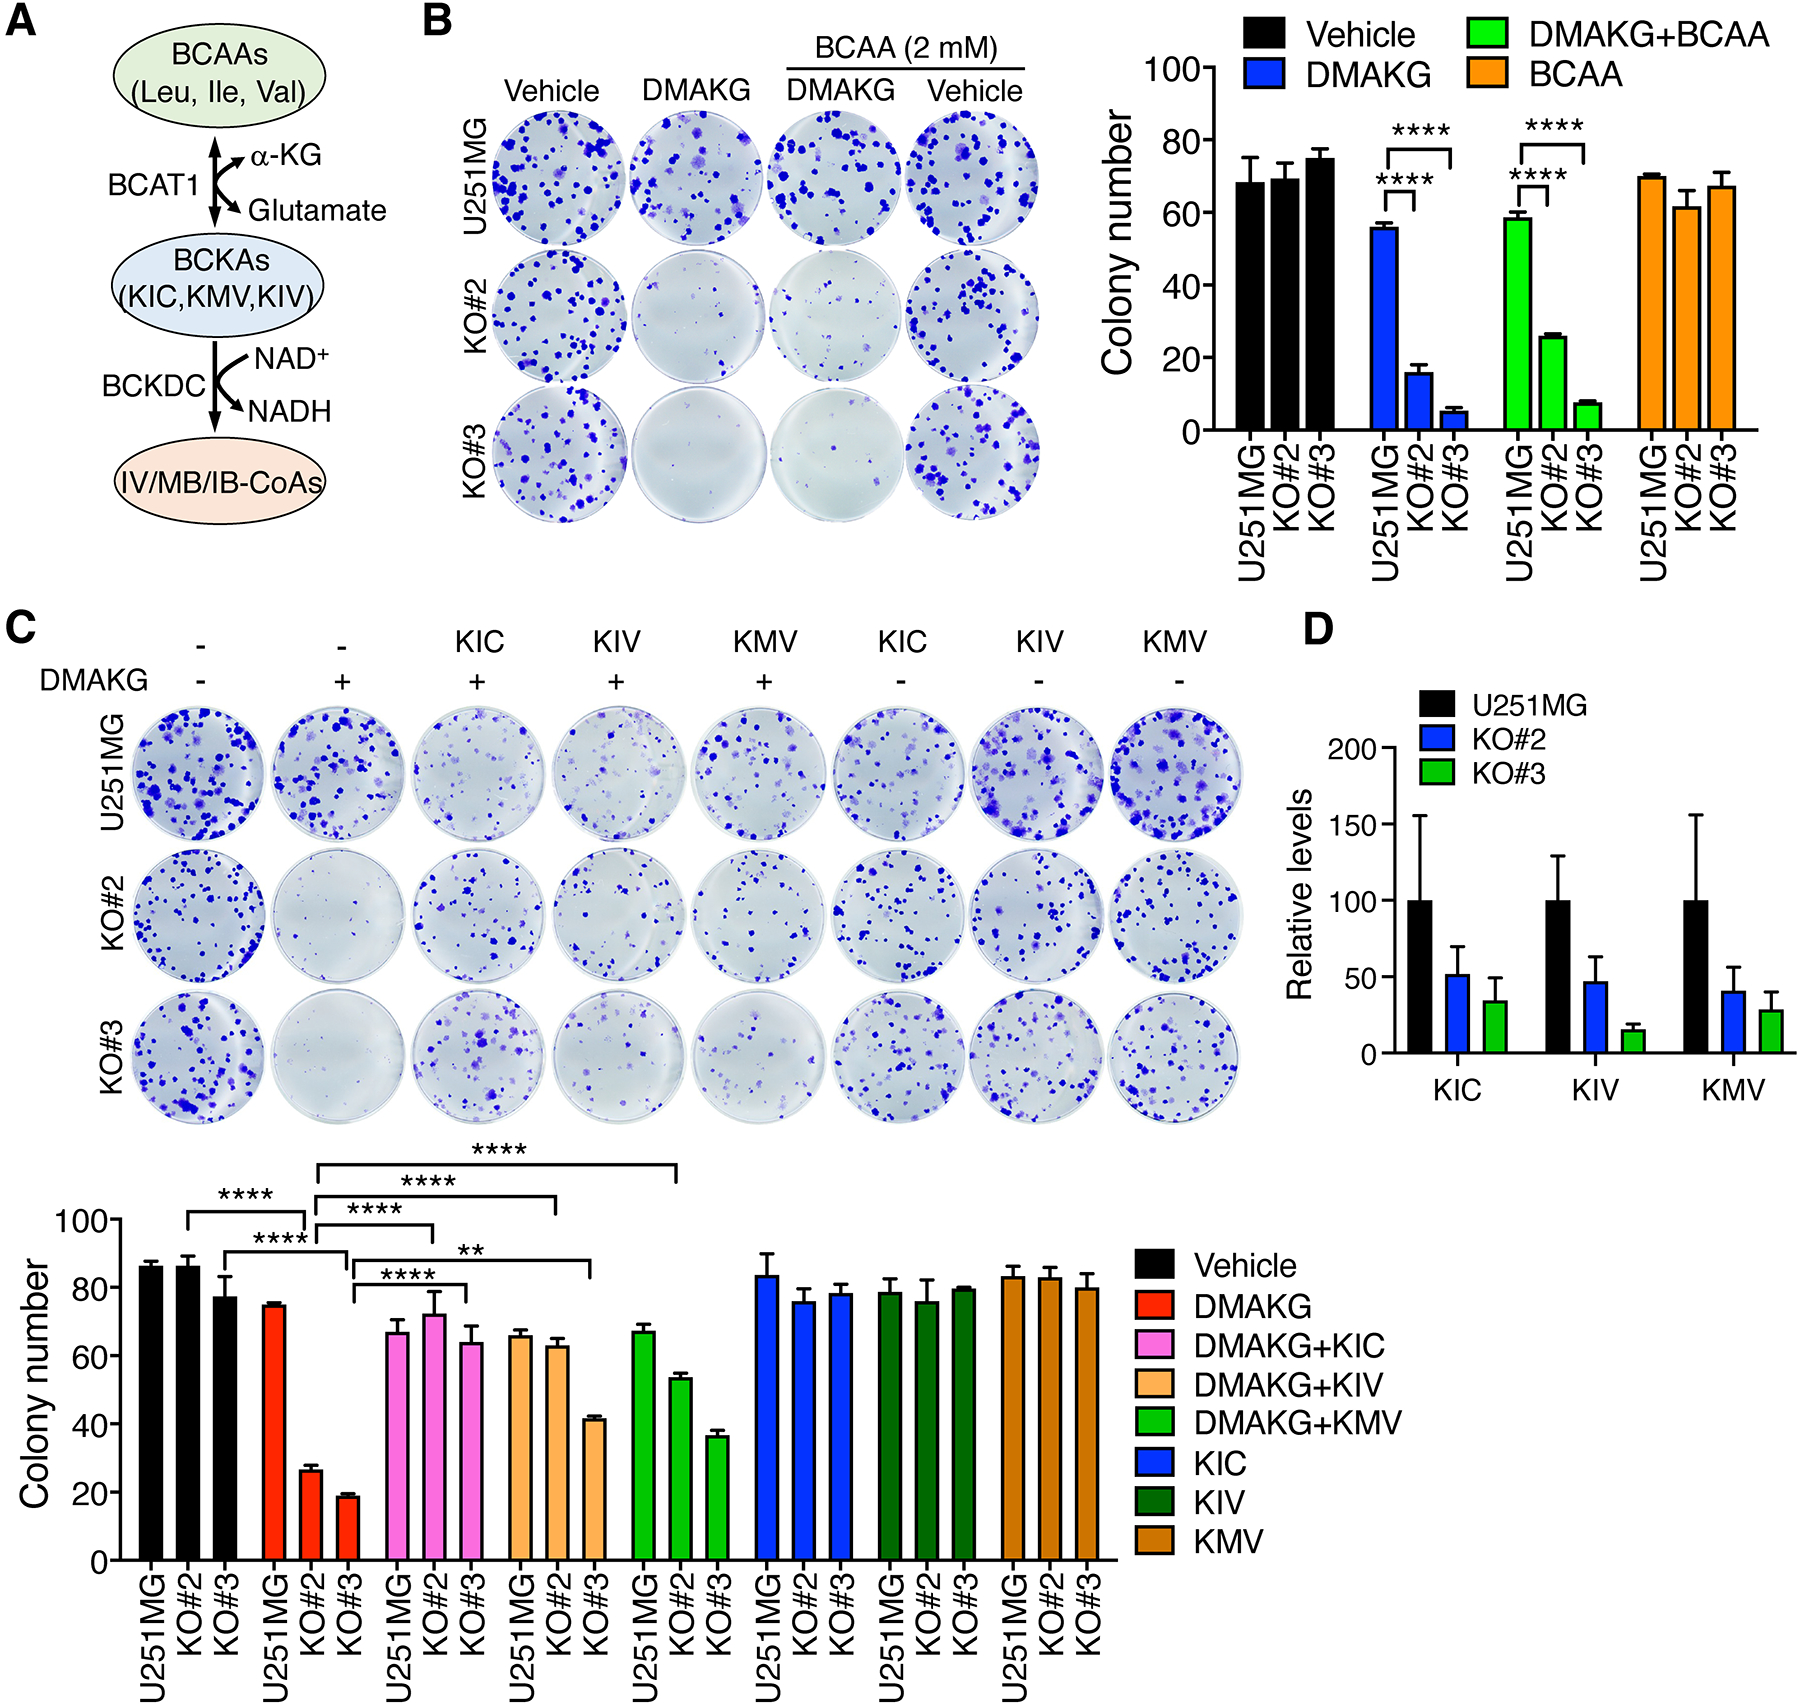
(A) The scheme of the BCAA metabolic pathway. (B) Clonogenic assay in parental and BCAT1 KO#2 or KO#3 U251MG cells treated with vehicle, DMAKG (10 mM), BCAA (2 mM), or both for 7 days. Representative images are shown at the left. The colonies are counted at the right (mean ± SEM, n = 3). (C) Clonogenic assay in parental and BCAT1 KO#2 or KO#3 U251MG cells treated with vehicle, DMAKG (10 mM), BCKA (1 mM), or both for 7 days. Representative images are shown at the top. The colonies are counted at the bottom (mean ± SEM, n = 3). (D) Mass spectrometry analysis of BCKA levels in parental and BCAT1 KO#2 or KO#3 U251MG cells (mean ± SEM, n = 3). **p < 0.01; ****p < 0.0001 by two-way ANOVA with Tukey’s test.