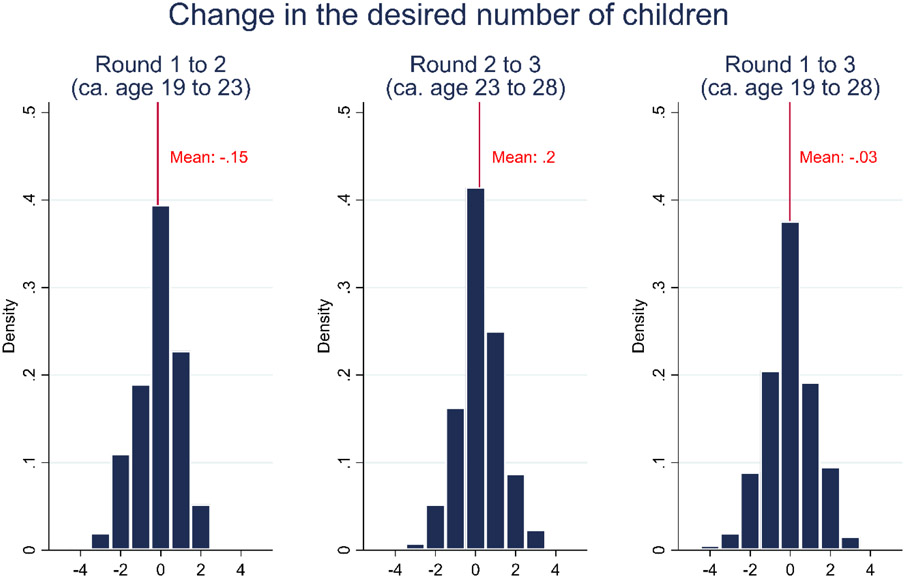
Figure 1: Distribution of changes in desired children between survey rounds.
Notes: This figure plots the distribution of changes in fertility desires between KLPS survey Rounds 1 and 2 (x2 – x1), Rounds 2 and 3 (x3 – x2), and Rounds 1 to 3 (x3 – x1) for the 239 women of the analysis sample who were interviewed in all three survey rounds. Women who gave non-numerical answers to the desired fertility question in one of the two survey rounds used for each graph or changed their desires by more than 4 children are dropped, leaving 231 women. Observations are weighted using survey weights from the later survey round, adjusted for the two-stage tracking design of that round. The vertical lines denote the average change in desires, with −0.146 between round 1 and 2, +0.196 between round 2 and 3, −0.029 between round 1 and 3.

