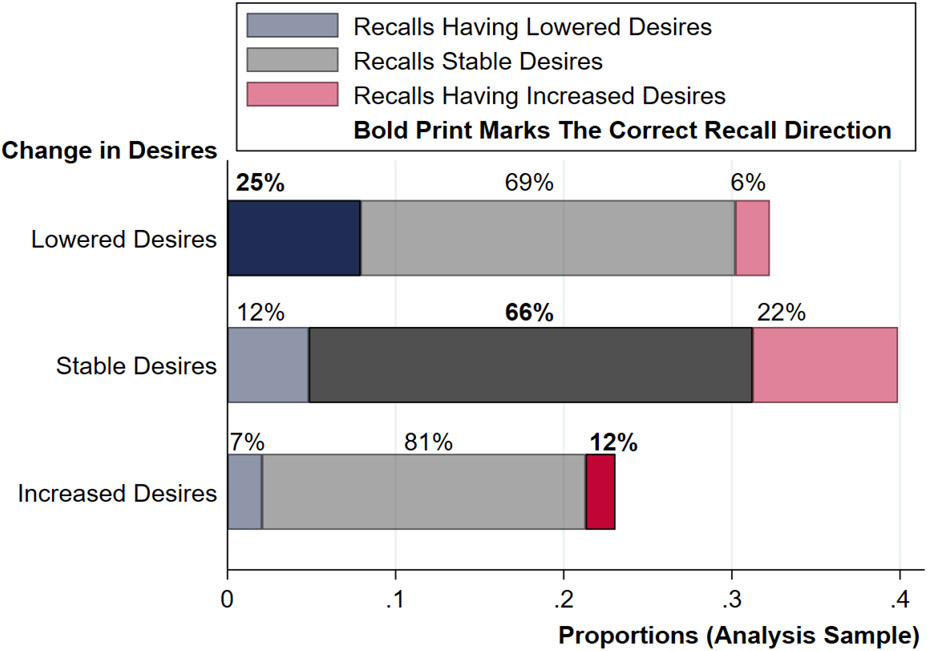
Figure 4: Recall patterns: Recalled direction of change in desires at round 2 conditional on direction of change in fertility desires between round 1 and round 2.
Notes: This graph plots the recalled direction of change in desires for all 277 women of the analysis sample interviewed in both Rounds 1 and 2, conditional on whether they had lowered their desires, had stable desires or had increased their desires between survey rounds 1 and 2. The graph uses Round 2 observation weights adjusted for the two-stage KLPS tracking design. The recalled direction of change in desires is constructed in the following way: an individual recalls having lowered if (i.e. if she recalls a higher desire than she currently reports), having had stable desires if (i.e. if she recalls the same desired fertility as she stated in round 2) and having increased desires if (i.e. if she remembers a desired fertility that is lower than her current desired fertility). Women's change in desires is coded similarly: those whose desired fertility was higher in round 1 than 2 have lowered their desires (i.e. x1 > x2), they had stable desires if the desired fertility was the same in both rounds (x1 < x2) and they have increased their desires if their stated desired fertility in round 2 is higher than in round 1 (i.e. x1 < x2). This figure indicates the proportions of women with lower, equal or increased desires (from top to bottom) and for each group reports which share within this group recall having lowered desires, having had stable desires or having increased desires. For each group, the “correct” recall direction is emphasized in bold colors. Note that those who lowered their desires are more than twice as likely to correctly recall the direction of change than those who increased their desires (25% vs 12%, with a p-value of .025). Those who increased desires in turn are more likely than those who lowered desires to believe they have had stable desires (81% vs. 69%, p-value of .062), and even more so than those who actually had stable desires (81% vs. 66%, p-value of .021). P-values from Fisher’s exact test and bootstrapped (with 1,000 draws) tests for decreasing vs. increasing desires (using unweighted shares) are as follows: 0.122 and 0.071 for correct recall, 0.040 and 0.034 for recall direction and 0.061 and 0.052 for recalling 0 change.

