. 2022 May 10;82(13):2485–2498. doi: 10.1158/0008-5472.CAN-22-0804

Figure 4.

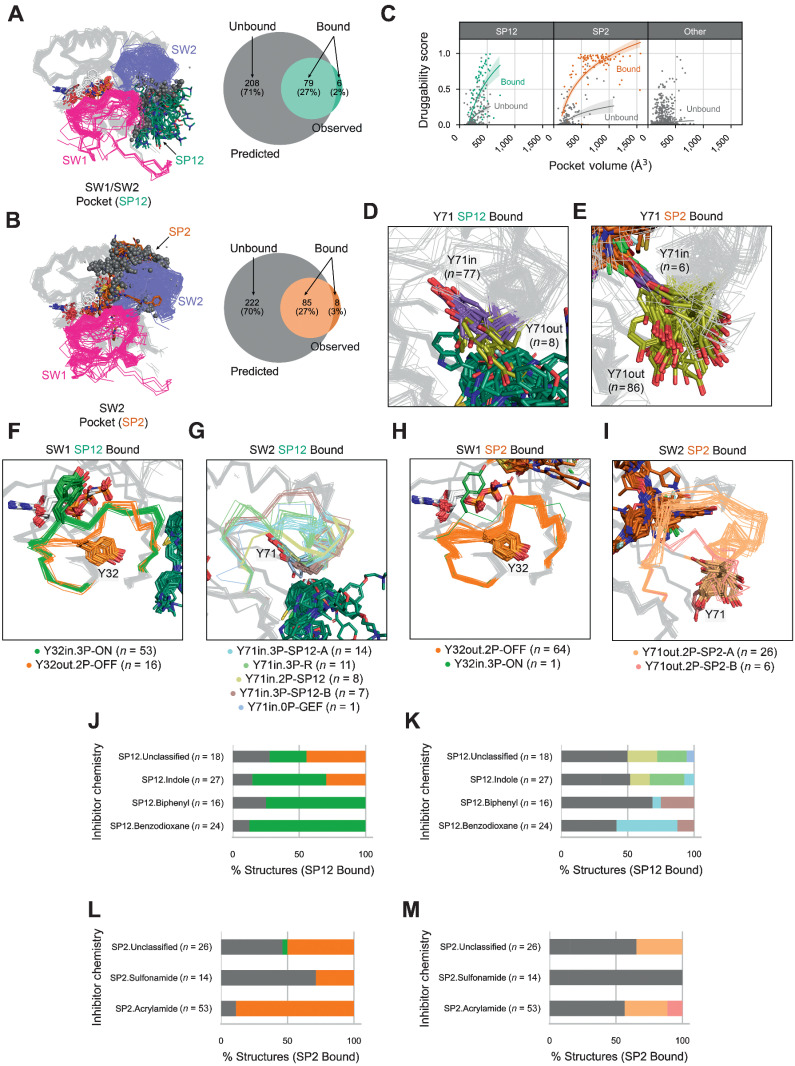
Figure 4. SW1 and SW2 conformations associated with inhibitor sites. Observed and predicted, SW1/SW2 pockets (SP12; A) and SW2 pockets (SP2; B) across RAS structures in the PDB. C, Pocket volumes and druggability scores across inhibitor-bound and unbound SP2, SP12, or other sites. Y71 positions in, SP12 (D) and SP2 inhibitor–bound structures (E). SW1 and SW2 conformations in RAS structures with an inhibitor-bound SP12 site (E and F) and an inhibitor-bound SP2 site (G and H). Percent of each SW1 and SW2 conformation bound to inhibitors with different chemistries at the SP12 site (I and J) and the SP2 site (K and L). I-J, colored by the same scheme as with gray indicating structures labeled outlier or disordered (E-H).

SW1 and SW2 conformations associated with inhibitor sites. A and B, Observed and predicted, SW1/SW2 pockets (SP12; A) and SW2 pockets (SP2; B) across RAS structures in the PDB. C, Pocket volumes and druggability scores across inhibitor-bound and unbound SP2, SP12, or other sites. D and E, Y71 positions in SP12 (D) and SP2 (E) inhibitor–bound structures. FI, SW1 and SW2 conformations in RAS structures with an inhibitor-bound SP12 site (F and G) and an inhibitor-bound SP2 site (H and I). JM, Percent of each SW1 and SW2 conformation bound to inhibitors with different chemistries at the SP12 site (J and K) and the SP2 site (L and M). JM are colored by the same scheme, with gray indicating structures labeled outlier or disordered (F–I).