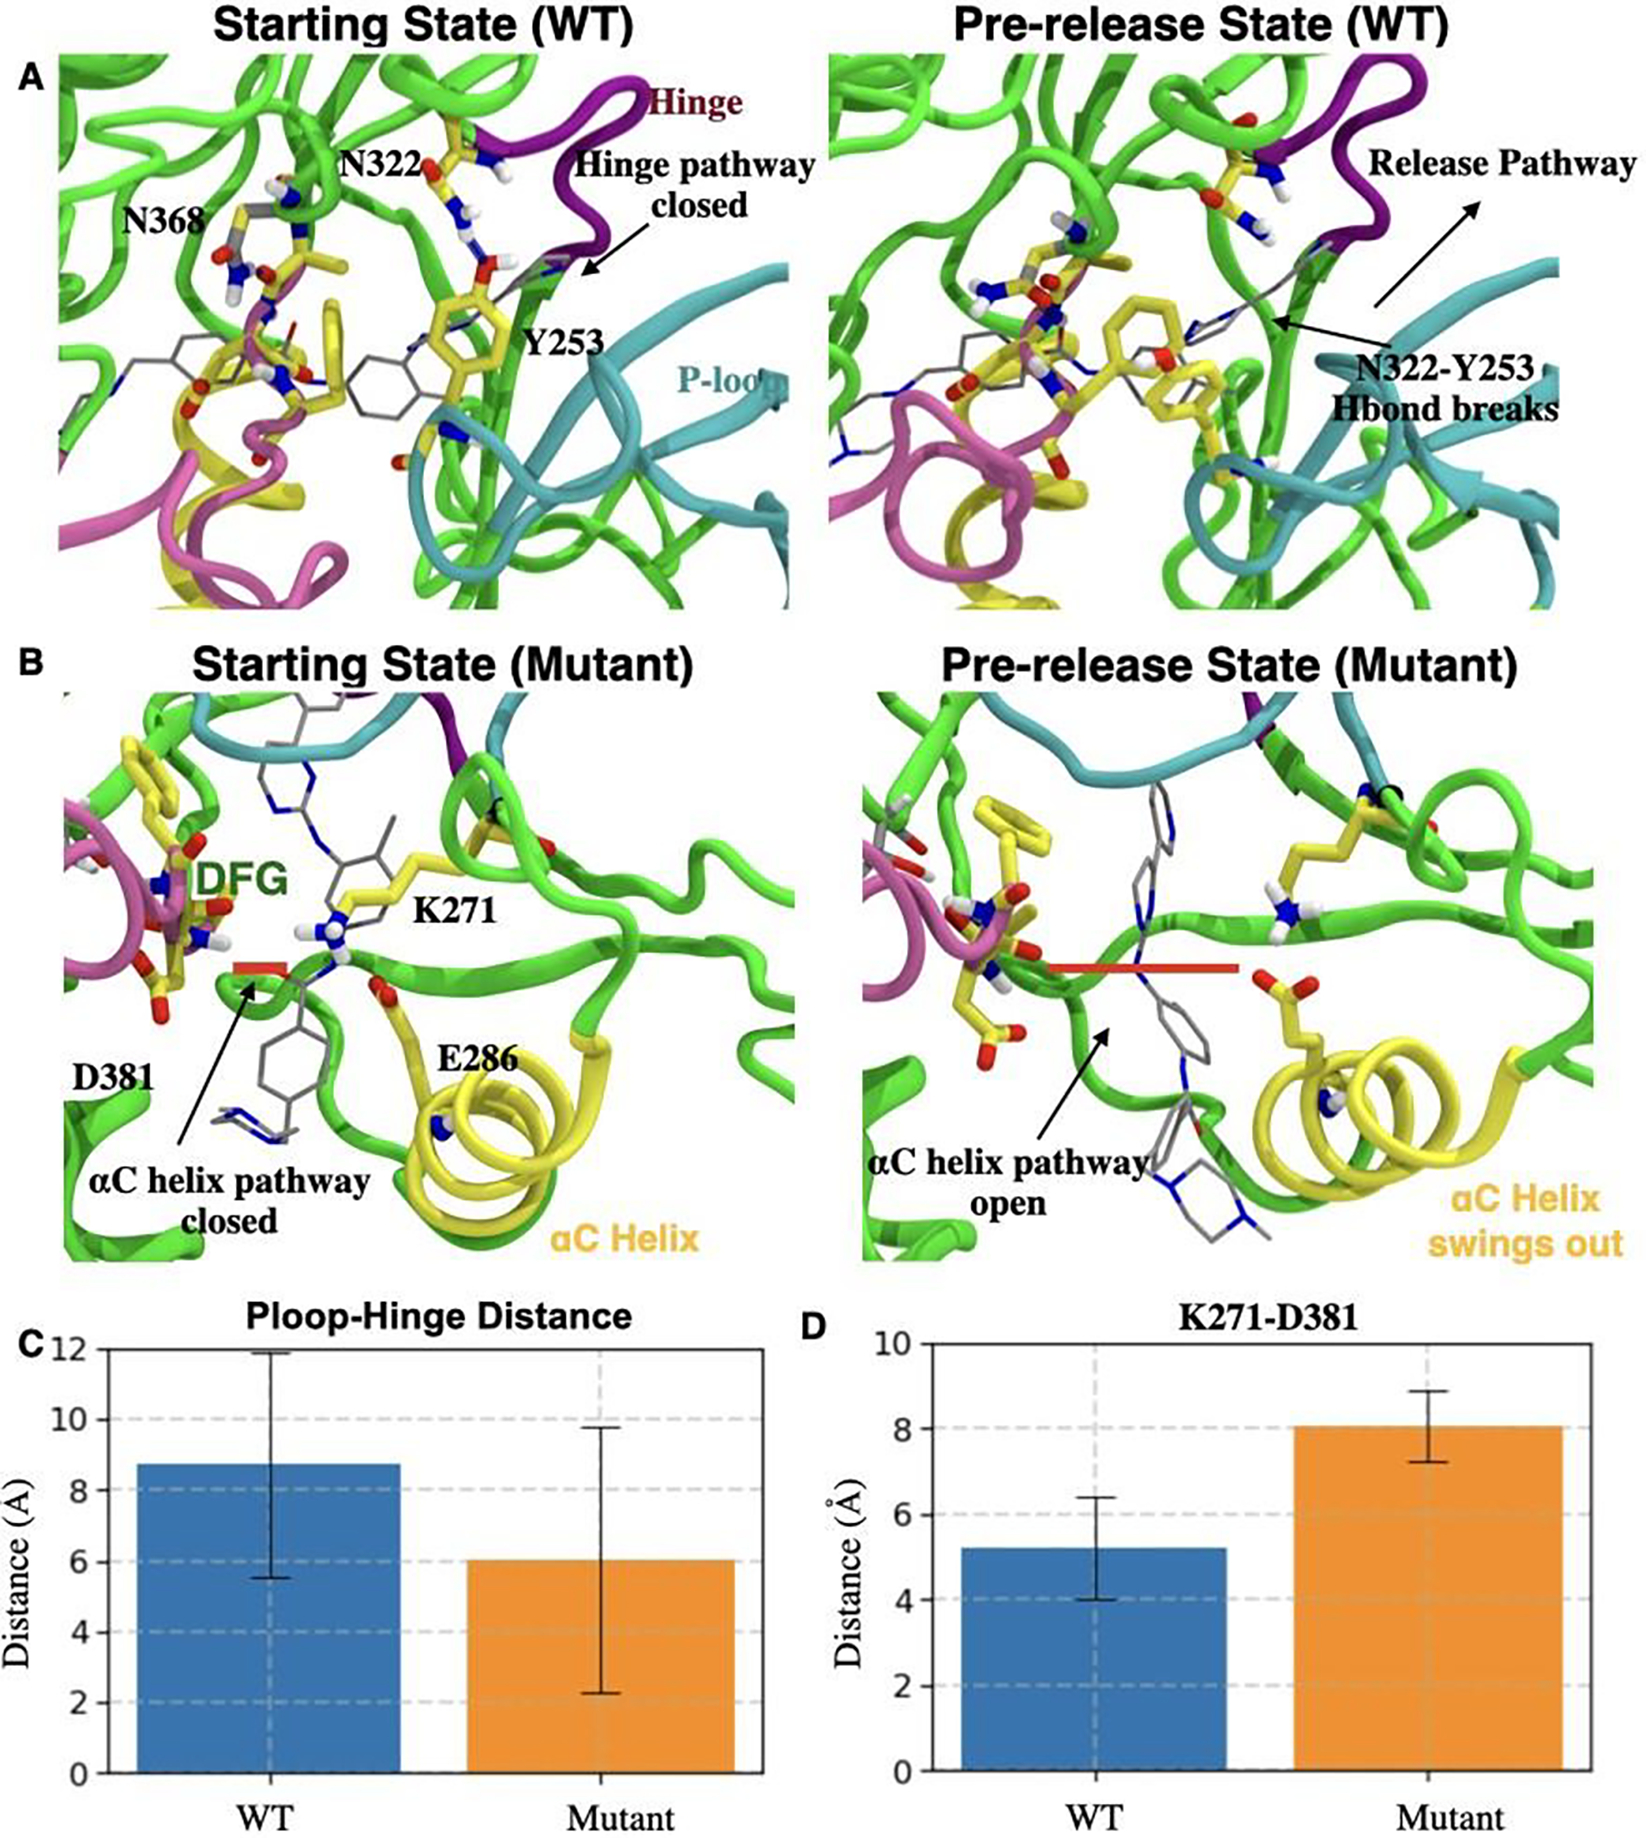
Figure 4:

A) Left: Starting state of WT Abl (Crystal structure). H-bond between Y253 (P-loop) and N322 (hinge) is shown as a blue dashed line. Right: Abl conformation transiting to the pre-release state involves disrupted H-bond between Y253 and N322 forming an open ligand release pathway depicted by a black arrow. B) Left: H-bond between D381 from the DFG motif and Imatinib (gray sticks) in N368S Abl is shown as a thick red line. Right: Conformational changes in N368S Abl as it transits to the pre-released state involve the disruption of the interaction network of E286, K271, Imatinib, and DFG motif. C) and D) respectively show the closest distance (with error bars) between C) Cα atoms of Y253 and N322 for WT Abl (blue) and N368S Abl (orange); and D) Cα atoms of K271 and D381 for WT Abl (blue) and N368S Abl (orange).
