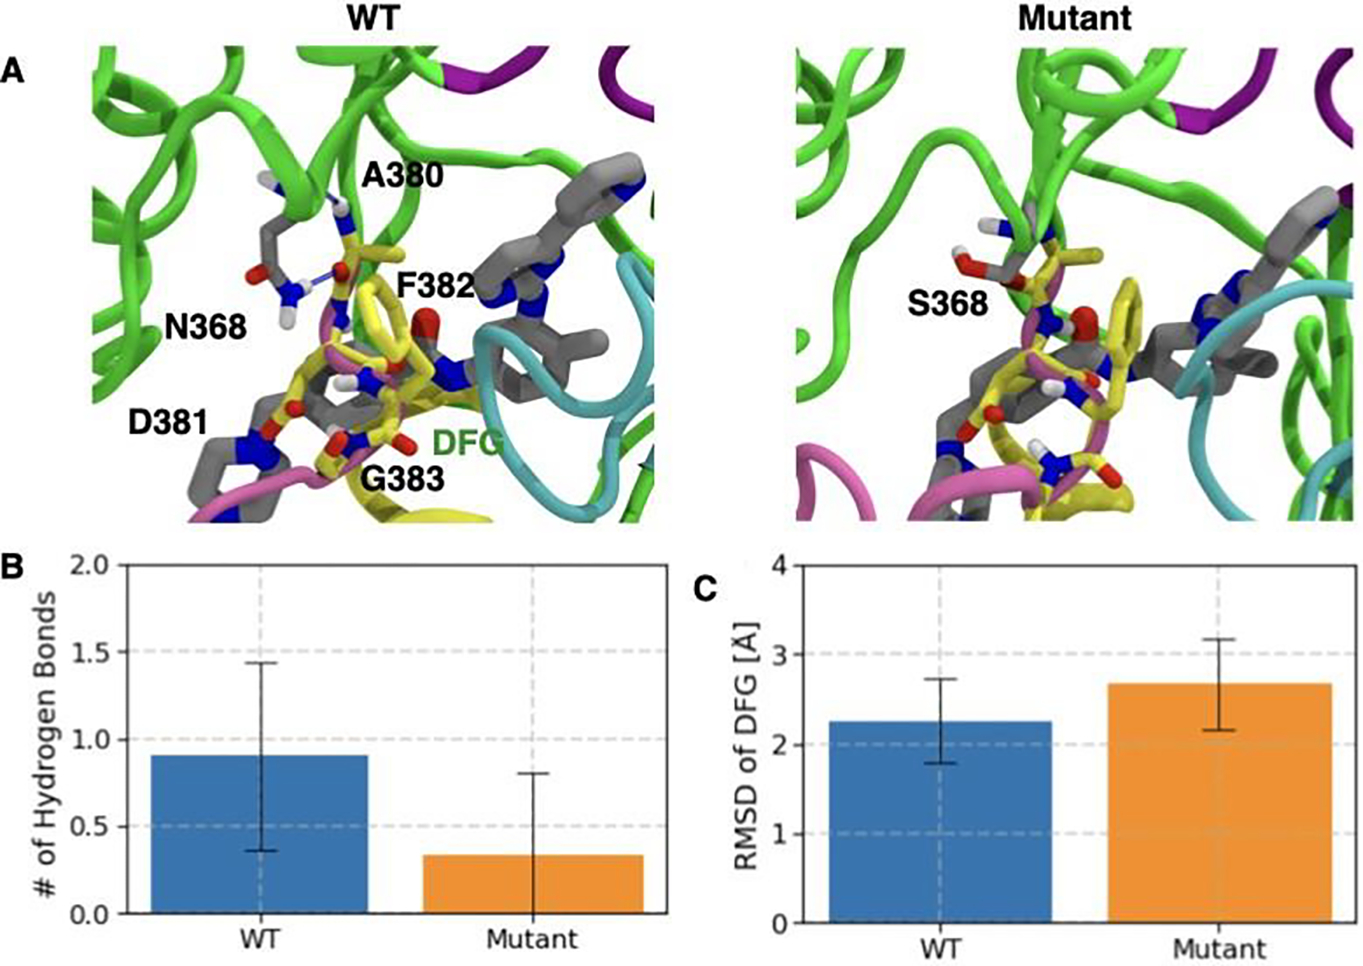
Figure 5:

Flexibility of DFG motif is modulated by H-bond interaction of N368 and the DFG loop. A) Crystal structure pose of Imatinib (gray licorice representation) in WT (left panel) and N368S (right panel). DFG motif is represented by yellow licorice. H-bond between N368 (gray licorice) and A380 is shown as blue dashed line. Bar plot and the error bar representing the mean and standard deviation of B) N368 and DFG motif for WT Abl (blue bar) and N368S Abl (orange bar) C) Root mean square deviation (RMSD) of DFG motif from the crystal structure position for WT Abl (blue bar) and N368S Abl (orange bar).
