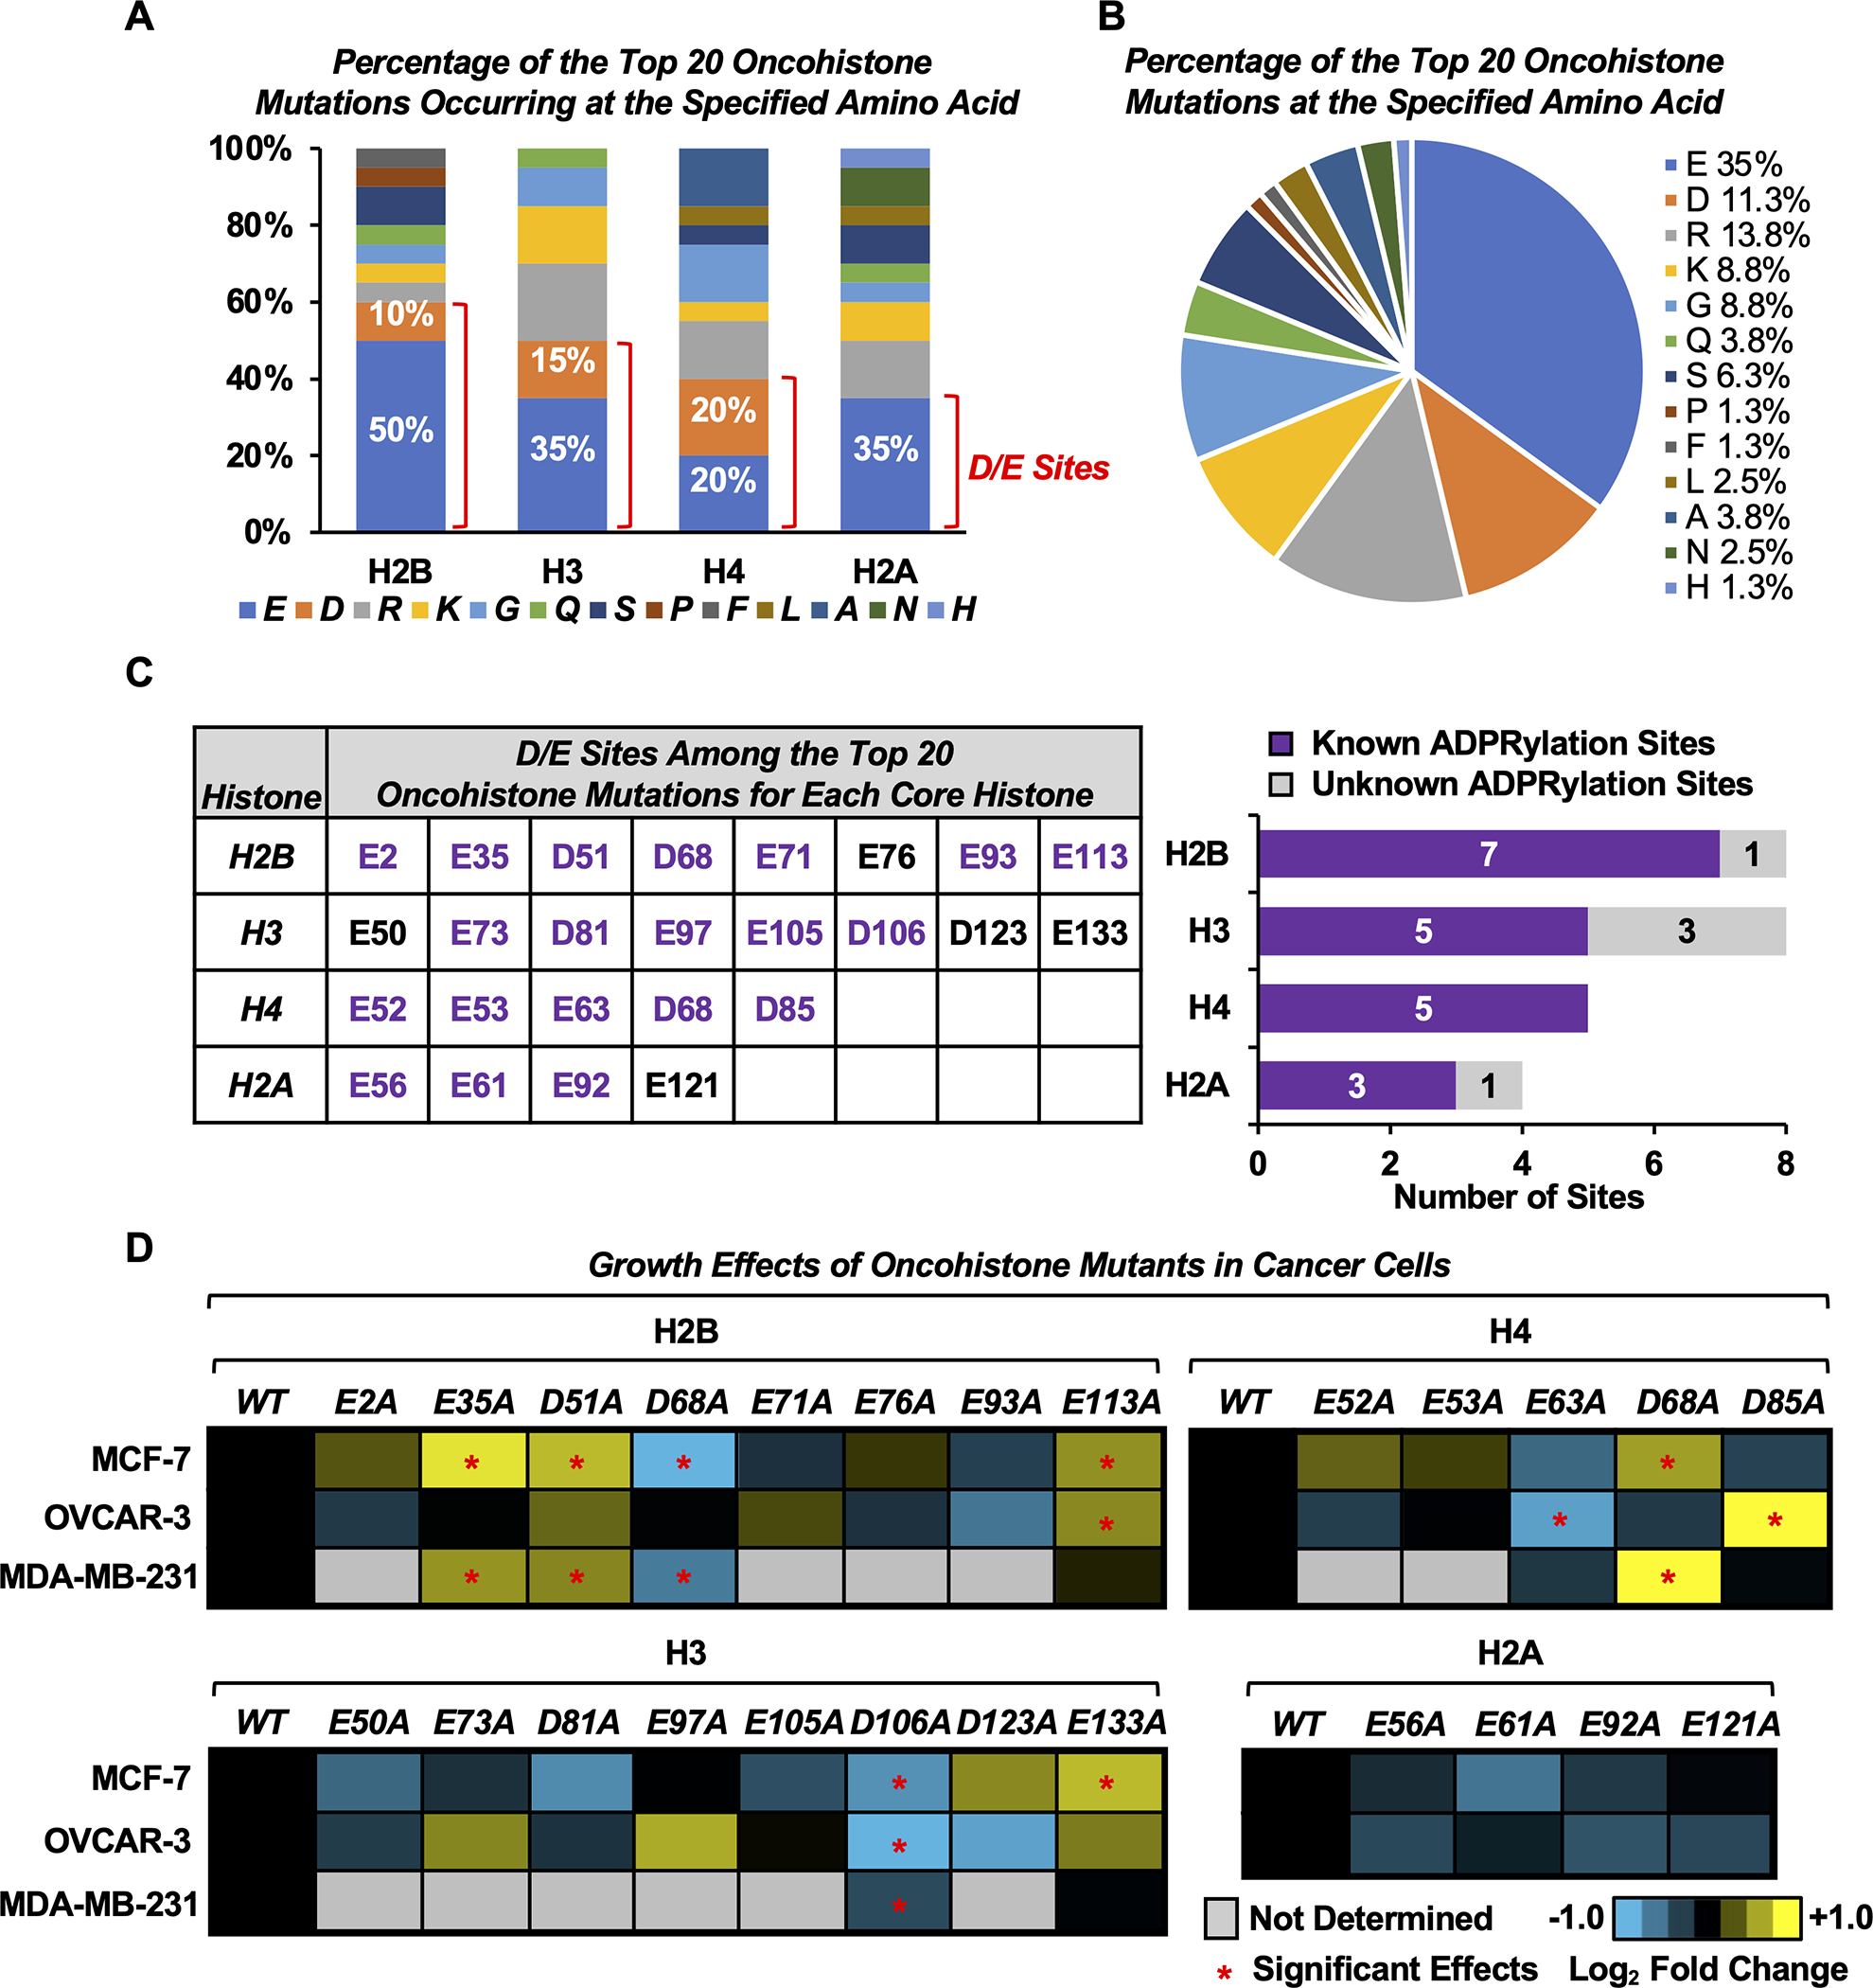
Fig. 1. Oncohistone mutations occur at sites of Asp and Glu ADPRylation.

A) Bar graph showing the percentage of the top 20 oncohistone mutations for each histone occurring at the specified amino acid. Those occurring at Asp (D) and Glu (E) sites are indicated.
B) Pie chart showing the percentage of the top 20 oncohistone mutations for all histones occurring at the specified amino acid.
C) Most of the top oncohistone mutations occurring at D and E sites have previously been identified by mass spectrometry as ADPRylation sites (“known sites”). Left, D/E sites among the top 20 oncohistone mutations for each core histone. Purple text indicates known ADPRylation sites. Right, the number of previously known and unknown histone ADPRylation sites from the collection in the left panel.
D) Heatmaps showing proliferation of MCF-7, OVCAR-3 and MDA-MB-231 cells expressing FLAG-tagged wild-type (WT) or alanine (A) mutants of D/E oncohistone mutation sites for individual core histones, assayed by crystal violet staining. Results represent the mean fold changes of cell proliferation for cells expressing the histone mutants versus cells expressing the cognate WT histone at day 7 (n = 3–5). Asterisks indicate significant differences from the WT (two-way ANOVA followed by Dunnett’s multiple comparisons test; * p < 0.05). The corresponding cell growth curves and Western blots for ectopic FLAG-tagged histone expression are shown in Supplementary Figs. S2–4.
[See also Supplementary Figs. S1–S5, Supplementary Table S1, and Supplementary Data S1]
