
Fig. 2. Mutation of the H2B-D51 ADPRylation site enhances cell proliferation and migration in MDA-MB-231 cells through gene regulation.
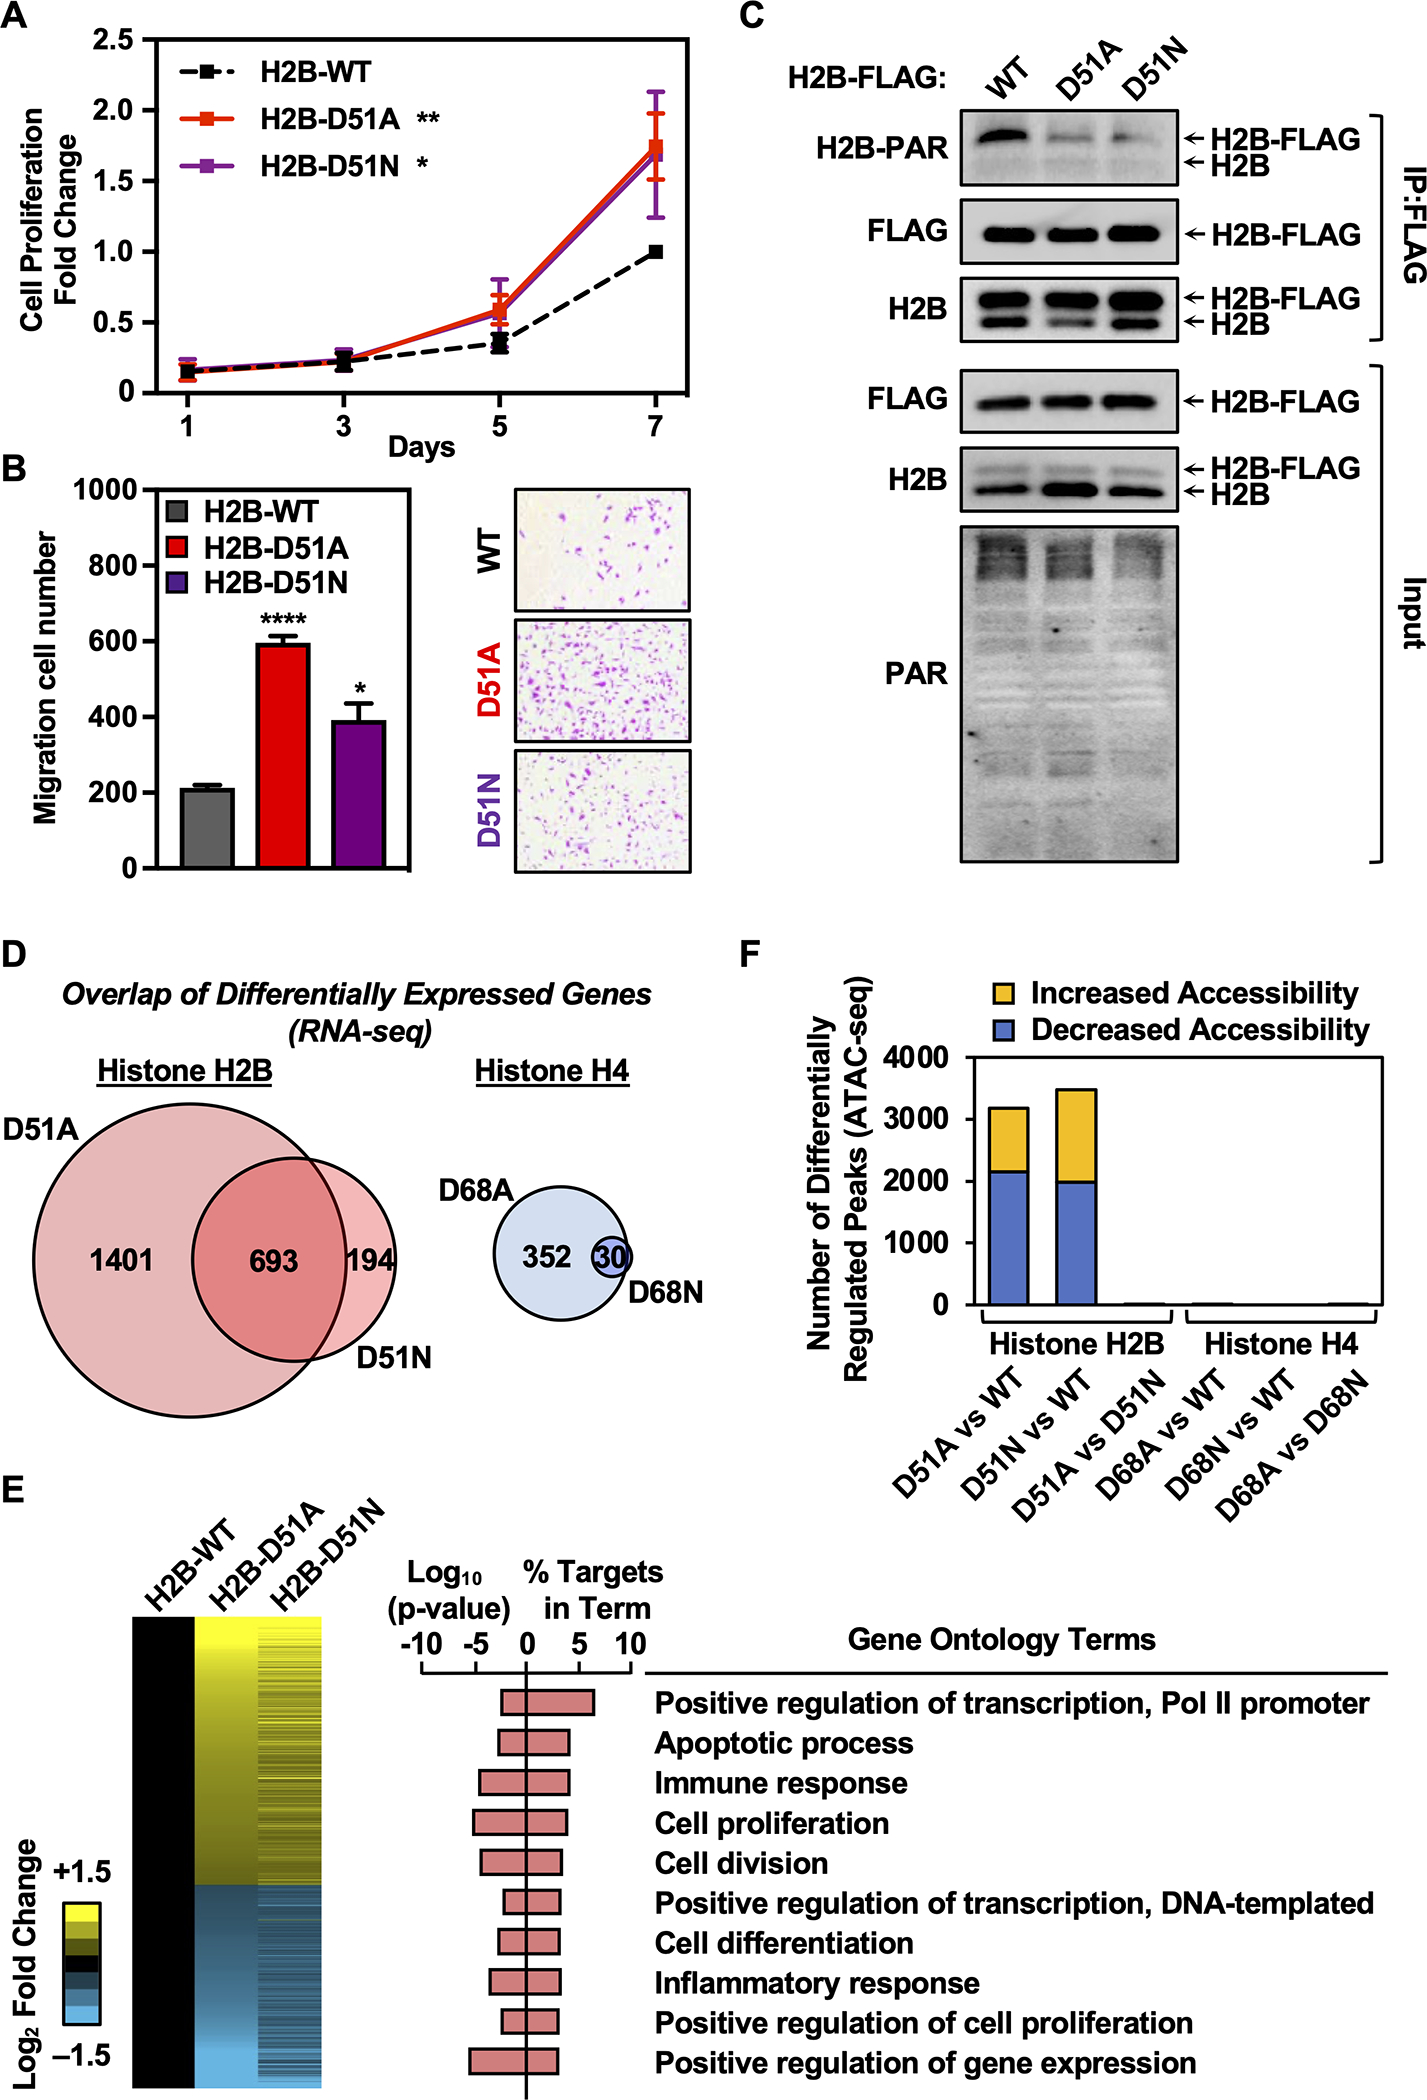
A) Growth curves of MDA-MB-231 cells ectopically expressing FLAG-tagged wild-type (WT), D51A, or D51N H2B assayed by crystal violet staining. Each point represents the mean ± SEM, n = 3. Asterisks indicate significant differences between the mutant and WT at day 7 (two-way ANOVA followed by Dunnett’s multiple comparisons test; * p < 0.05, and ** p < 0.01).
B) Cell migration assays for MDA-MB-231 cells ectopically expressing FLAG-tagged WT, D51A, or D51N H2B. Left, Quantification of cell migration numbers. Each bar represents the mean ± SEM, n = 3. Asterisks indicate significant differences between the mutant and WT (Student’s t-test; * p < 0.05, and **** p < 0.0001). Right, Representative images.
C) Western blots showing the levels of ADPRylation on H2B in MDA-MB-231 cells ectopically expressing FLAG-tagged WT, D51A, or D51N H2B after immunoprecipitation of FLAG-tagged nucleosomes.
D) Comparison of gene expression alterations mediated by H2B-D51 and H4-D68 oncohistone mutants in MDA-MB-231 cells as assessed by RNA-seq. Left, Venn diagram depicting the overlap of differentially expressed genes in cells ectopically expressing H2B-D51A and D51N mutants versus WT H2B. Right, Venn diagram depicting the overlap of differentially expressed genes in cells ectopically expressing H4-D68A and D68N mutants versus WT H4.
E) Regulation of gene expression programs in breast cancer cells by H2B-D51 oncohistone mutations. Left, Heatmaps representing the fold change of common differentially expressed genes from RNA-seq performed in MDA-MB-231 cells ectopically expressing FLAG-tagged WT, D51A, or D51N H2B. Right, Gene ontology terms enriched for the common differentially expressed genes in MDA-MB-231 cells ectopically expressing the H2B-D51 mutant versus cells expressing WT H2B.
F) Comparison of chromatin accessibility alterations mediated by H2B-D51 and H4-D68 mutants in MDA-MB-231 cells as assessed by ATAC-seq performed in cells ectopically expressing WT, D51A, or D51N H2B, or WT, D68A, or D68N H4. Yellow, differentially upregulated ATAC-seq peaks; Blue, differentially downregulated ATAC-seq peaks. Minimum counts 10, FDR < 0.05, fold-change cutoff 1.5.
[See also Supplementary Figs. S6–S8]