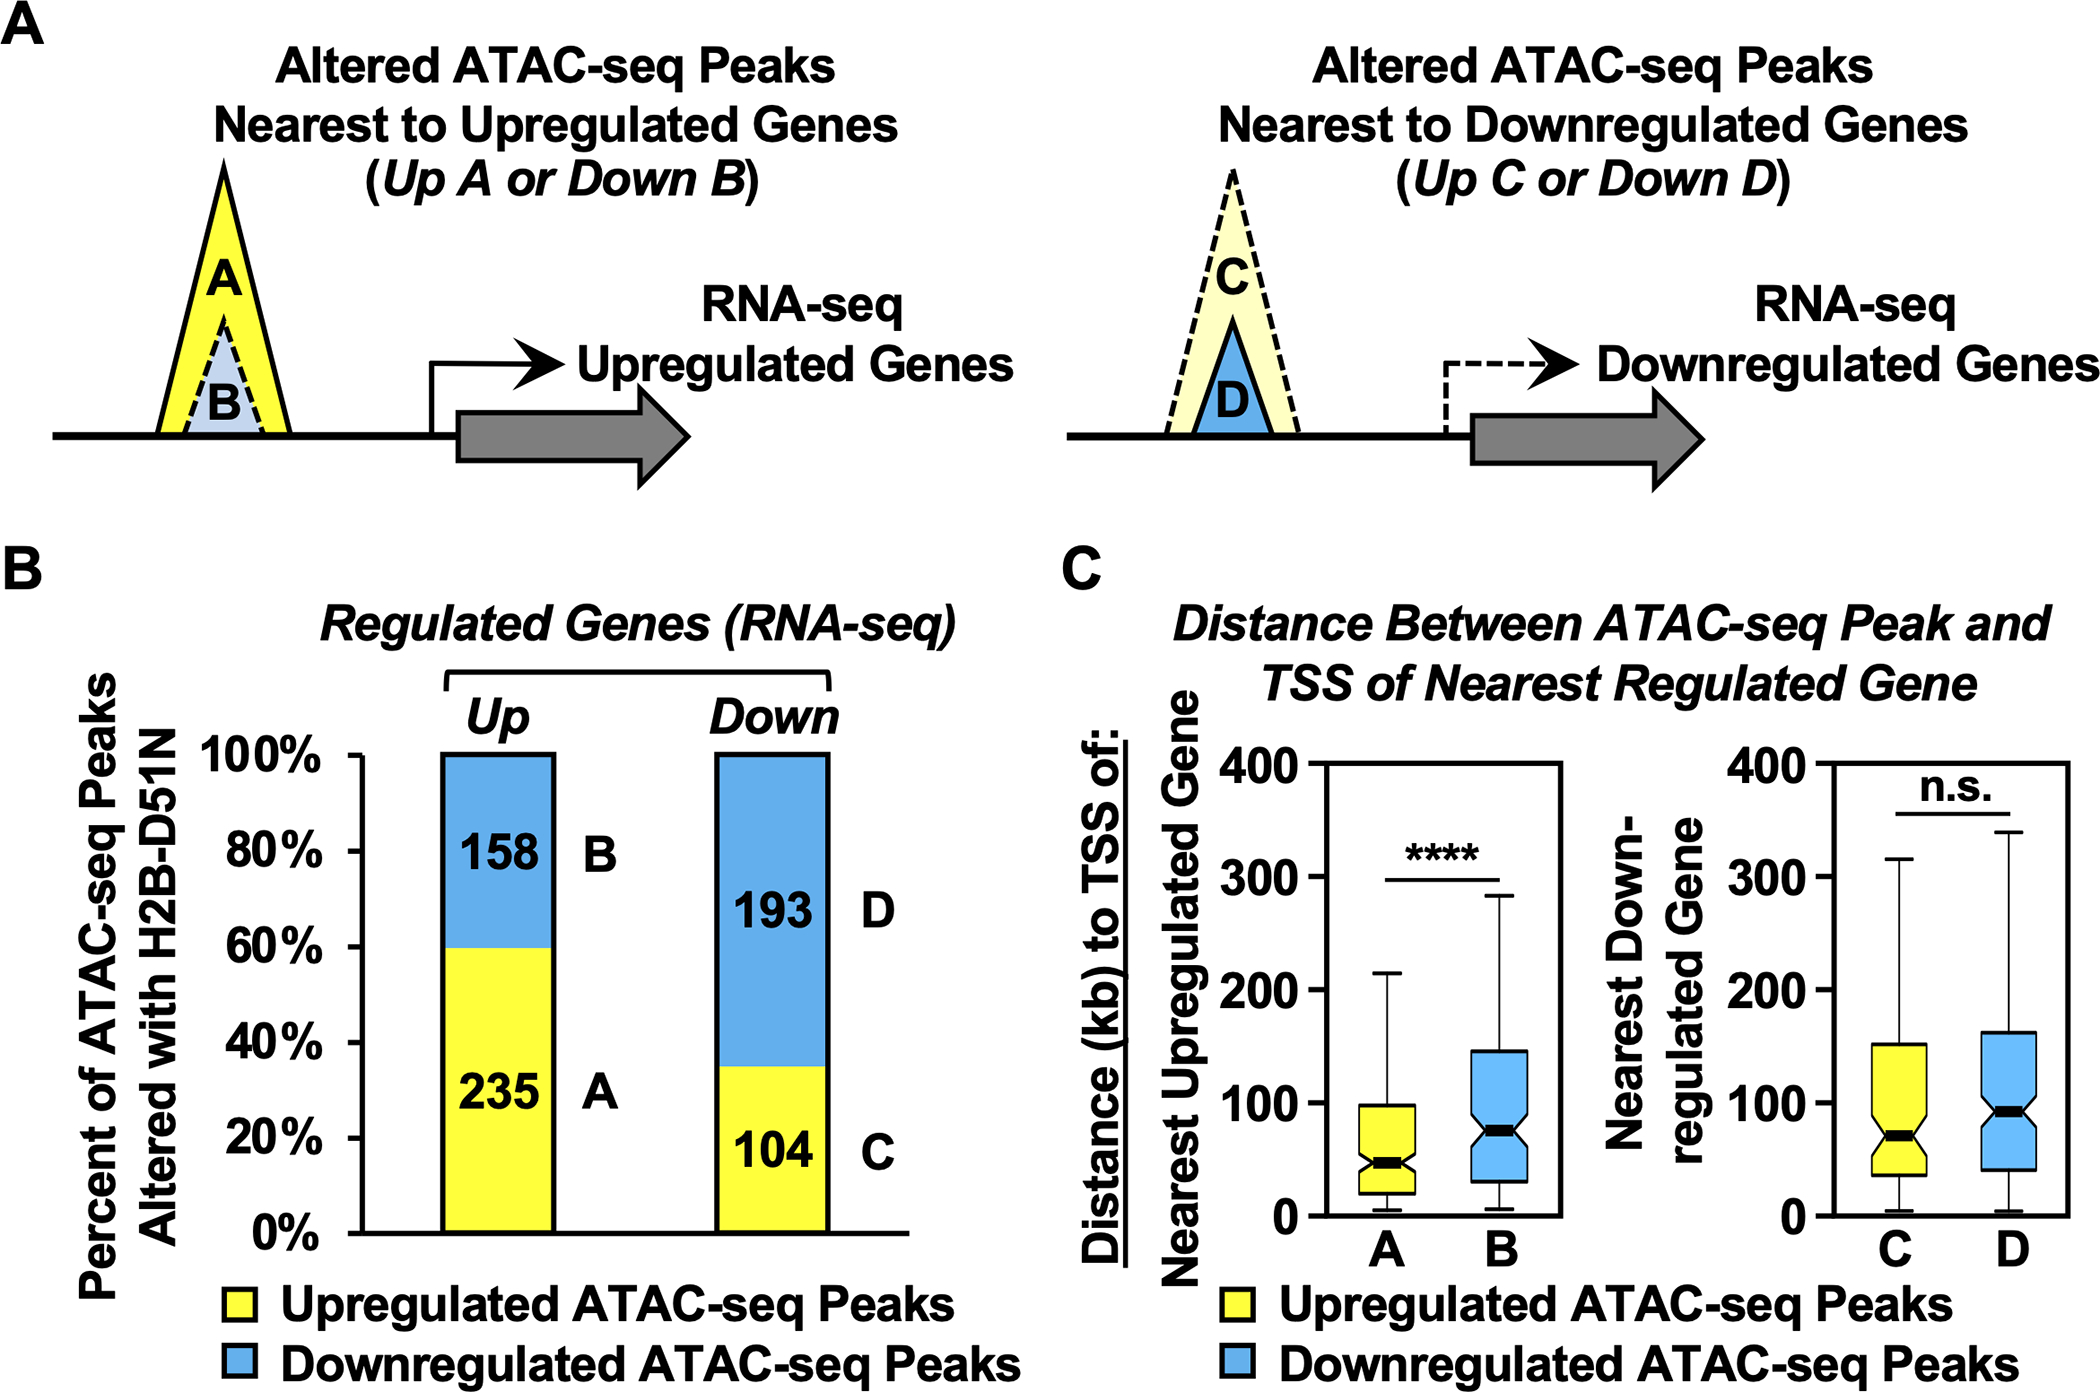
Fig. 5. H2B-D51 oncohistone mutations promote the upregulation of gene expression by increasing chromatin accessibility.

A) Schematic diagram showing the integration of ATAC-seq data with RNA-seq data to link chromatin accessibility to changes in gene expression in MDA-MB-231 cells expressing the H2B-D51N oncohistone mutant. Based on chromatin accessibility (i.e., ATAC-seq) and gene expression (i.e., RNA-seq) that was up- or downregulated by expression of the H2B-D51N mutant (versus WT H2B), the ATAC-seq peaks were categorized into four groups: ATAC-seq peaks upregulated (Group A) or downregulated (Group B) with the H2B-D51N mutant located nearest to an upregulated gene, and ATAC-seq peaks upregulated (Group C) or downregulated (Group D) with the H2B-D51N mutant located nearest to a downregulated gene.
B) Percent of upregulated or downregulated ATAC-seq peaks altered by expression of the H2B-D51N mutant located nearest to an upregulated (left: n = 393) or downregulated (right: n = 297) gene based on RNA-seq. The A, B, C, D labeling refers to the groups shown in panel A.
C) Box plots showing the average distance (in kb) between the center of the altered ATAC-seq peaks to the TSSs of the nearest upregulated or downregulated genes, as indicated. Asterisks indicate significant differences, p = 9.86 ×10⁻⁵. The A, B, C, D labeling refers to the groups shown in panel A.
[See also Supplementary Fig. S12]
