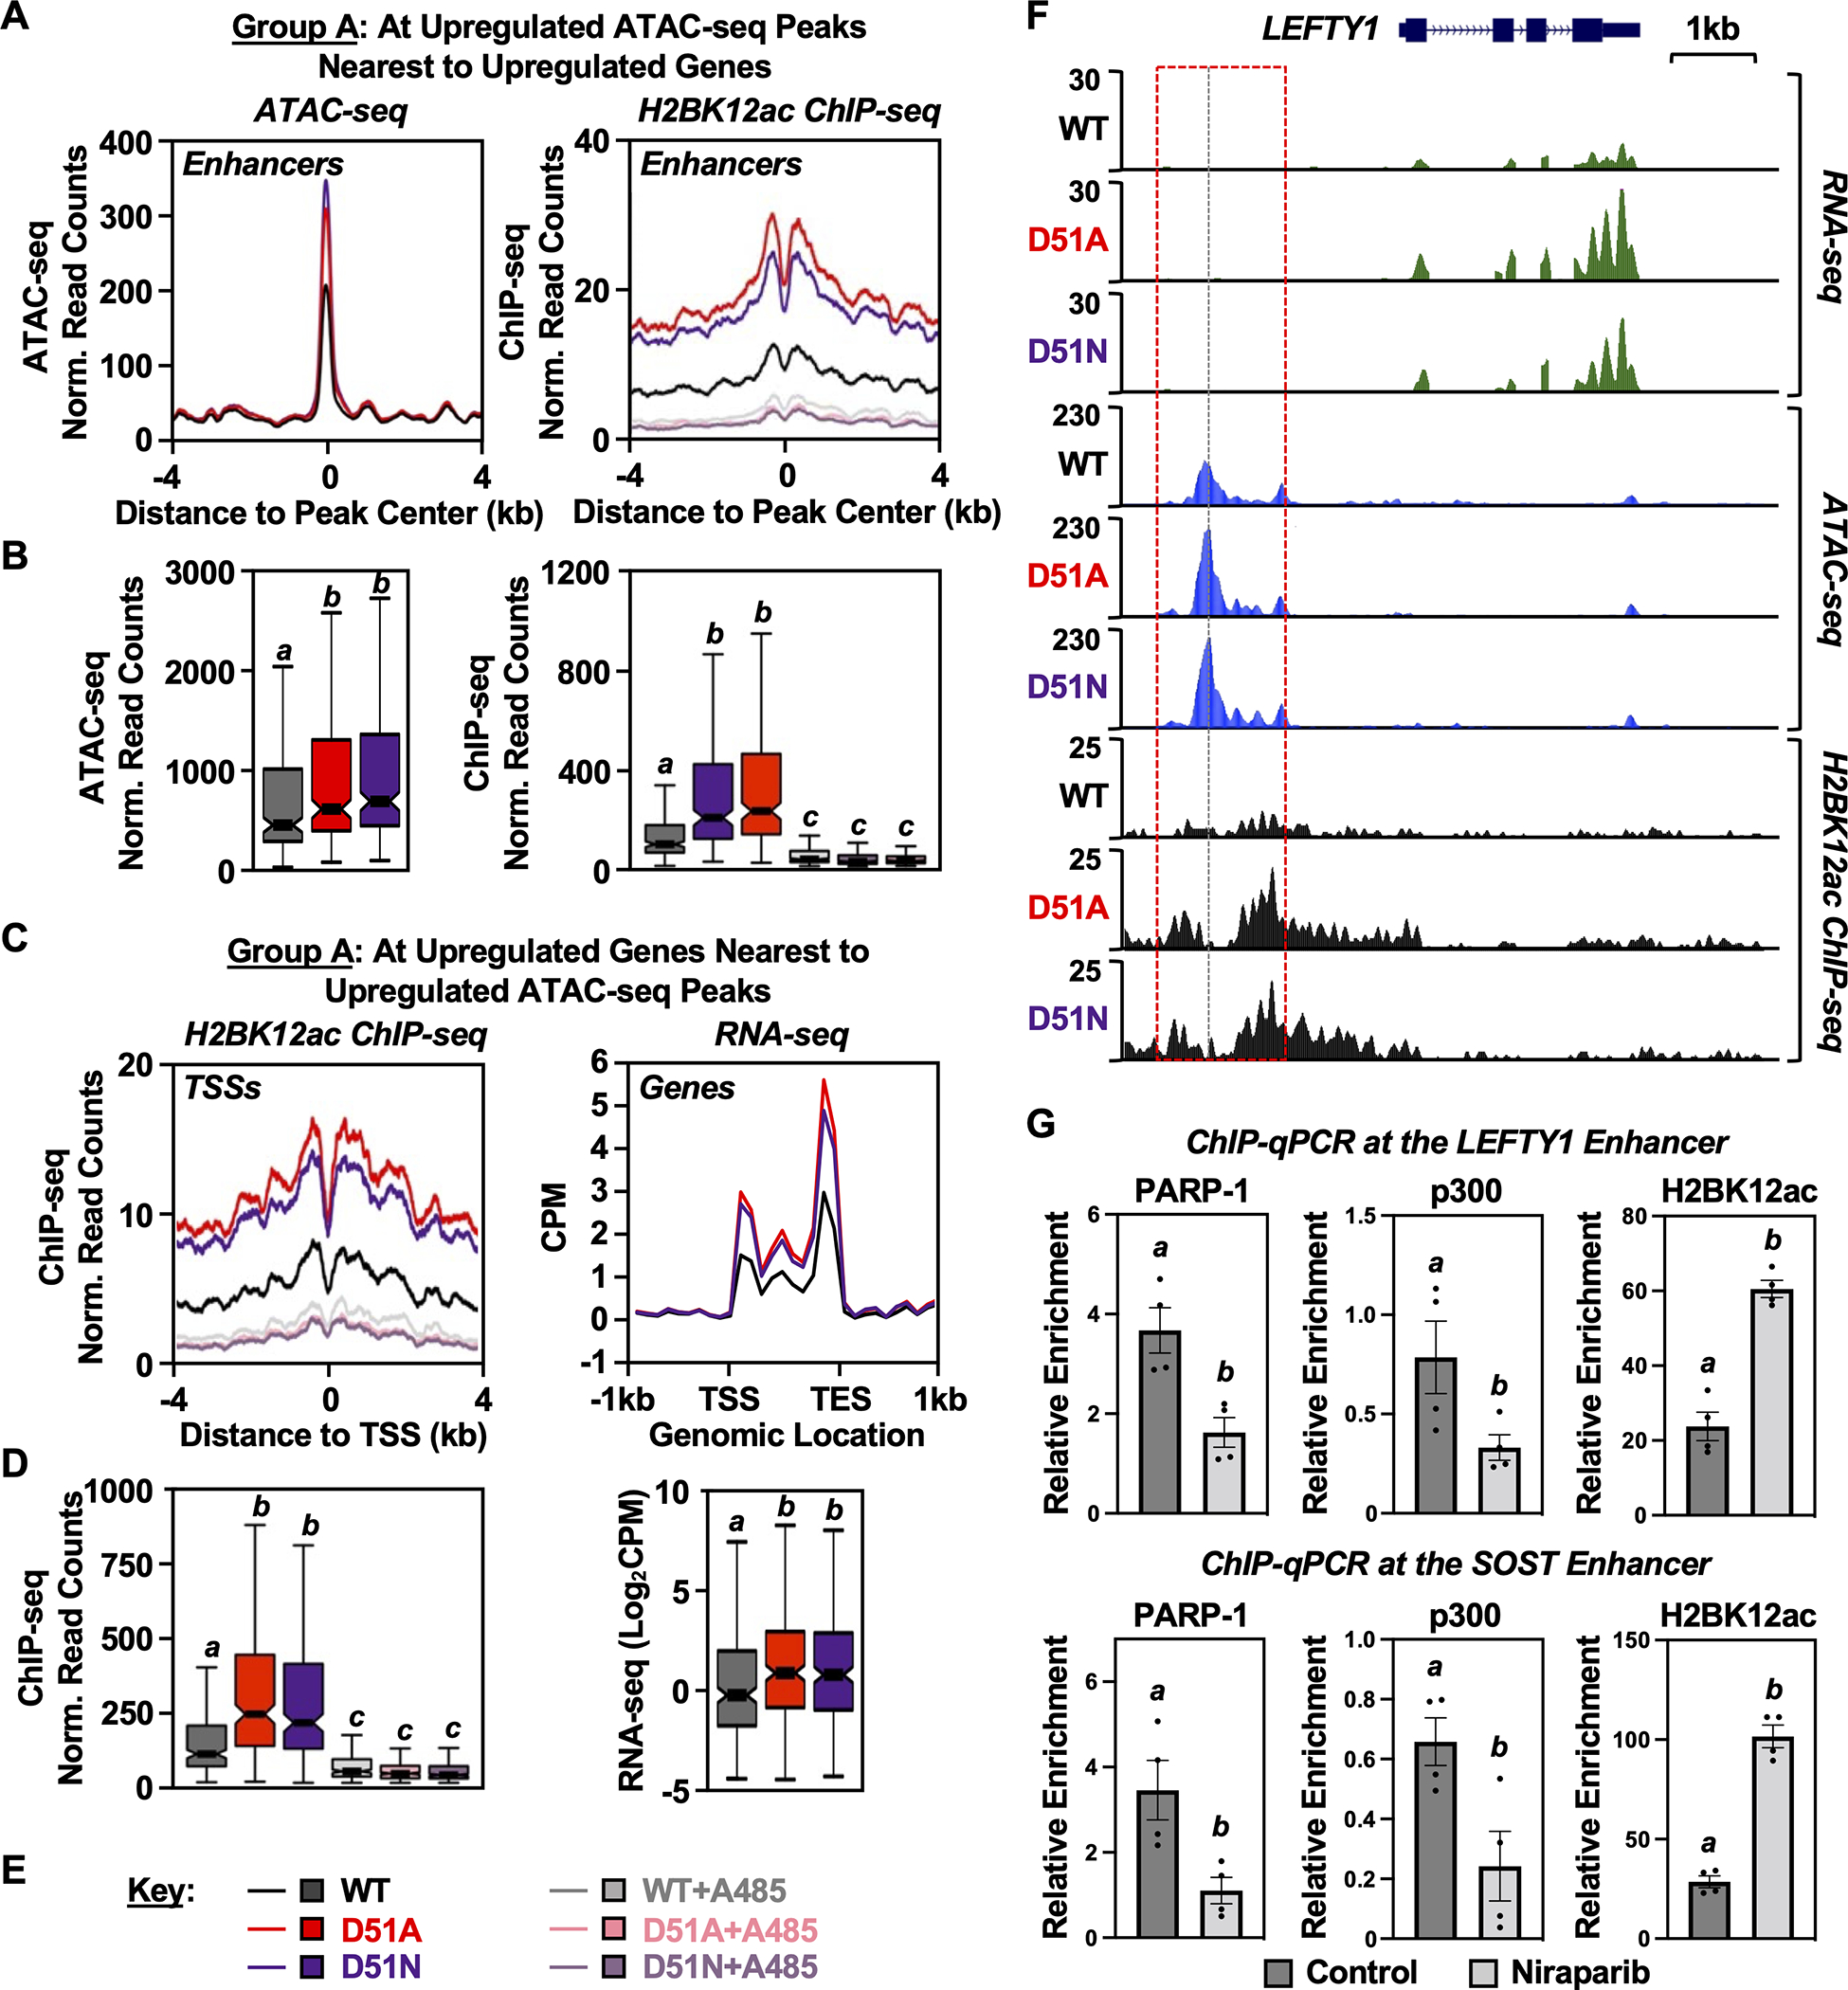
Fig. 6. H2B-D51 oncohistone mutations link site-specific histone ADPRylation, chromatin accessibility, H2BK12 acetylation, and gene expression outcomes.

A and B) Metaplots (A) and box plots (B) of ATAC-seq (left) and H2BK12ac ChIP-seq (right) data at the Group A ATAC-seq peaks described in Fig. 5A (i.e., H2B-D51-upregulated ATAC-seq peaks located nearest to upregulated genes). Bars marked with different letters are significantly different from each other (Wilcoxon rank sum test, p < 8 ×10⁻⁷).
C and D) Metaplots (C) and box plots (D) of H2BK12ac ChIP-seq (left) and RNA-seq (right) data at the TSSs of upregulated genes nearest to the Group A ATAC-seq peaks described in Fig. 5A. Bars marked with different letters are significantly different from each other (Wilcoxon rank sum test, p < 8 ×10⁻⁷ for ChIP-seq data and p < 3 ×10⁻⁴ for RNA-seq data).
E) Key for the conditions used in the other panels of this figure. Genomic assays were performed in MDA-MB-231 cells ectopically expressing FLAG-tagged WT, D51A, or D51N H2B ± treatment with A485 (5 μM, 2 hours) or vehicle (DMSO).
F) Genome browser tracks representing the RNA-seq, ATAC-seq, and H2BK12ac ChIP-seq data at genomic locus (LEFTY1) containing a gene upregulated upon expression of the H2B-D51 oncohistone mutants in MDA-MB-231 cells.
G) ChIP-qPCR assays for PARP-1, p300, and H2BK12ac in MDA-MB-231 cells treated with vehicle or the PARPi Niraparib (10 μM, 2 hours) as indicated. PARP-1, p300, and H2BK12ac enrichment was assessed at the enhancers of LEFTY1 and SOST genes using gene-specific primers. These sites exhibit increased H2BK12ac by ChIP-seq in the presence of the H2B-D51 ADPRylation site mutants. Each column represents the mean ± SEM (n = 4). Bars marked with different letters are significantly different from each other (Student’s t-test; p < 0.05).
[See also Supplementary Figs. S13–S16]
