
Figure 3. DNA damage and cell death induced by exatecan.
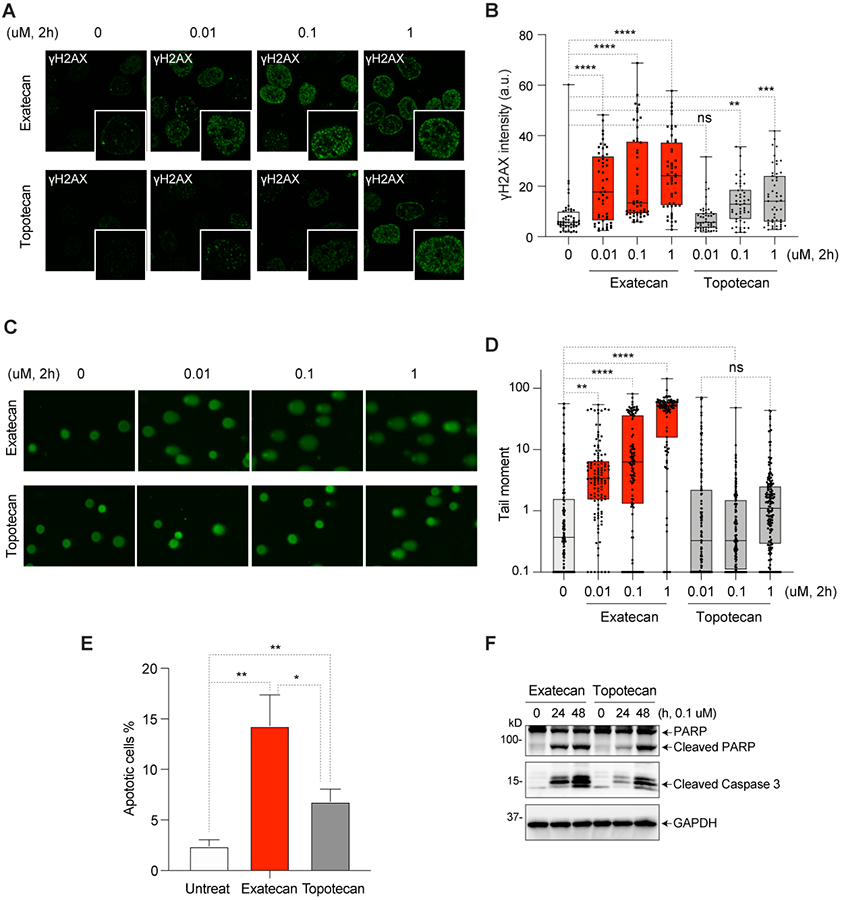
A. Representative immunofluorescence images of γH2AX (green) in exatecan- or topotecan-treated DU145 cells. B. Intensity of γH2AX fluorescence (average per cell) for the experiment depicted in panels A (mean ± SEM, N = 50/each) ** p-value <0.002, ***p-value <0.0004, ****p-value <0.0001. a.u., arbitrary units. C. Representative images of comet analysis in DU145 cells treated with exatecan and topotecan. D. Quantitation of tail moments of experiments depicted in panel B (mean ± SEM, N = 100/each) are quantified with the Open Comet/ImageJ program. ** p-value <0.006, ****p-value <0.0001. E. Apoptotic cell death induced by exatecan and topotecan and measured by Annexin V/PI staining. * p-value <0.01, **p-value <0.005. F. Cleavage of PARP1 and caspase-3 in exatecan and topotecan treated cells measured by Western blotting.