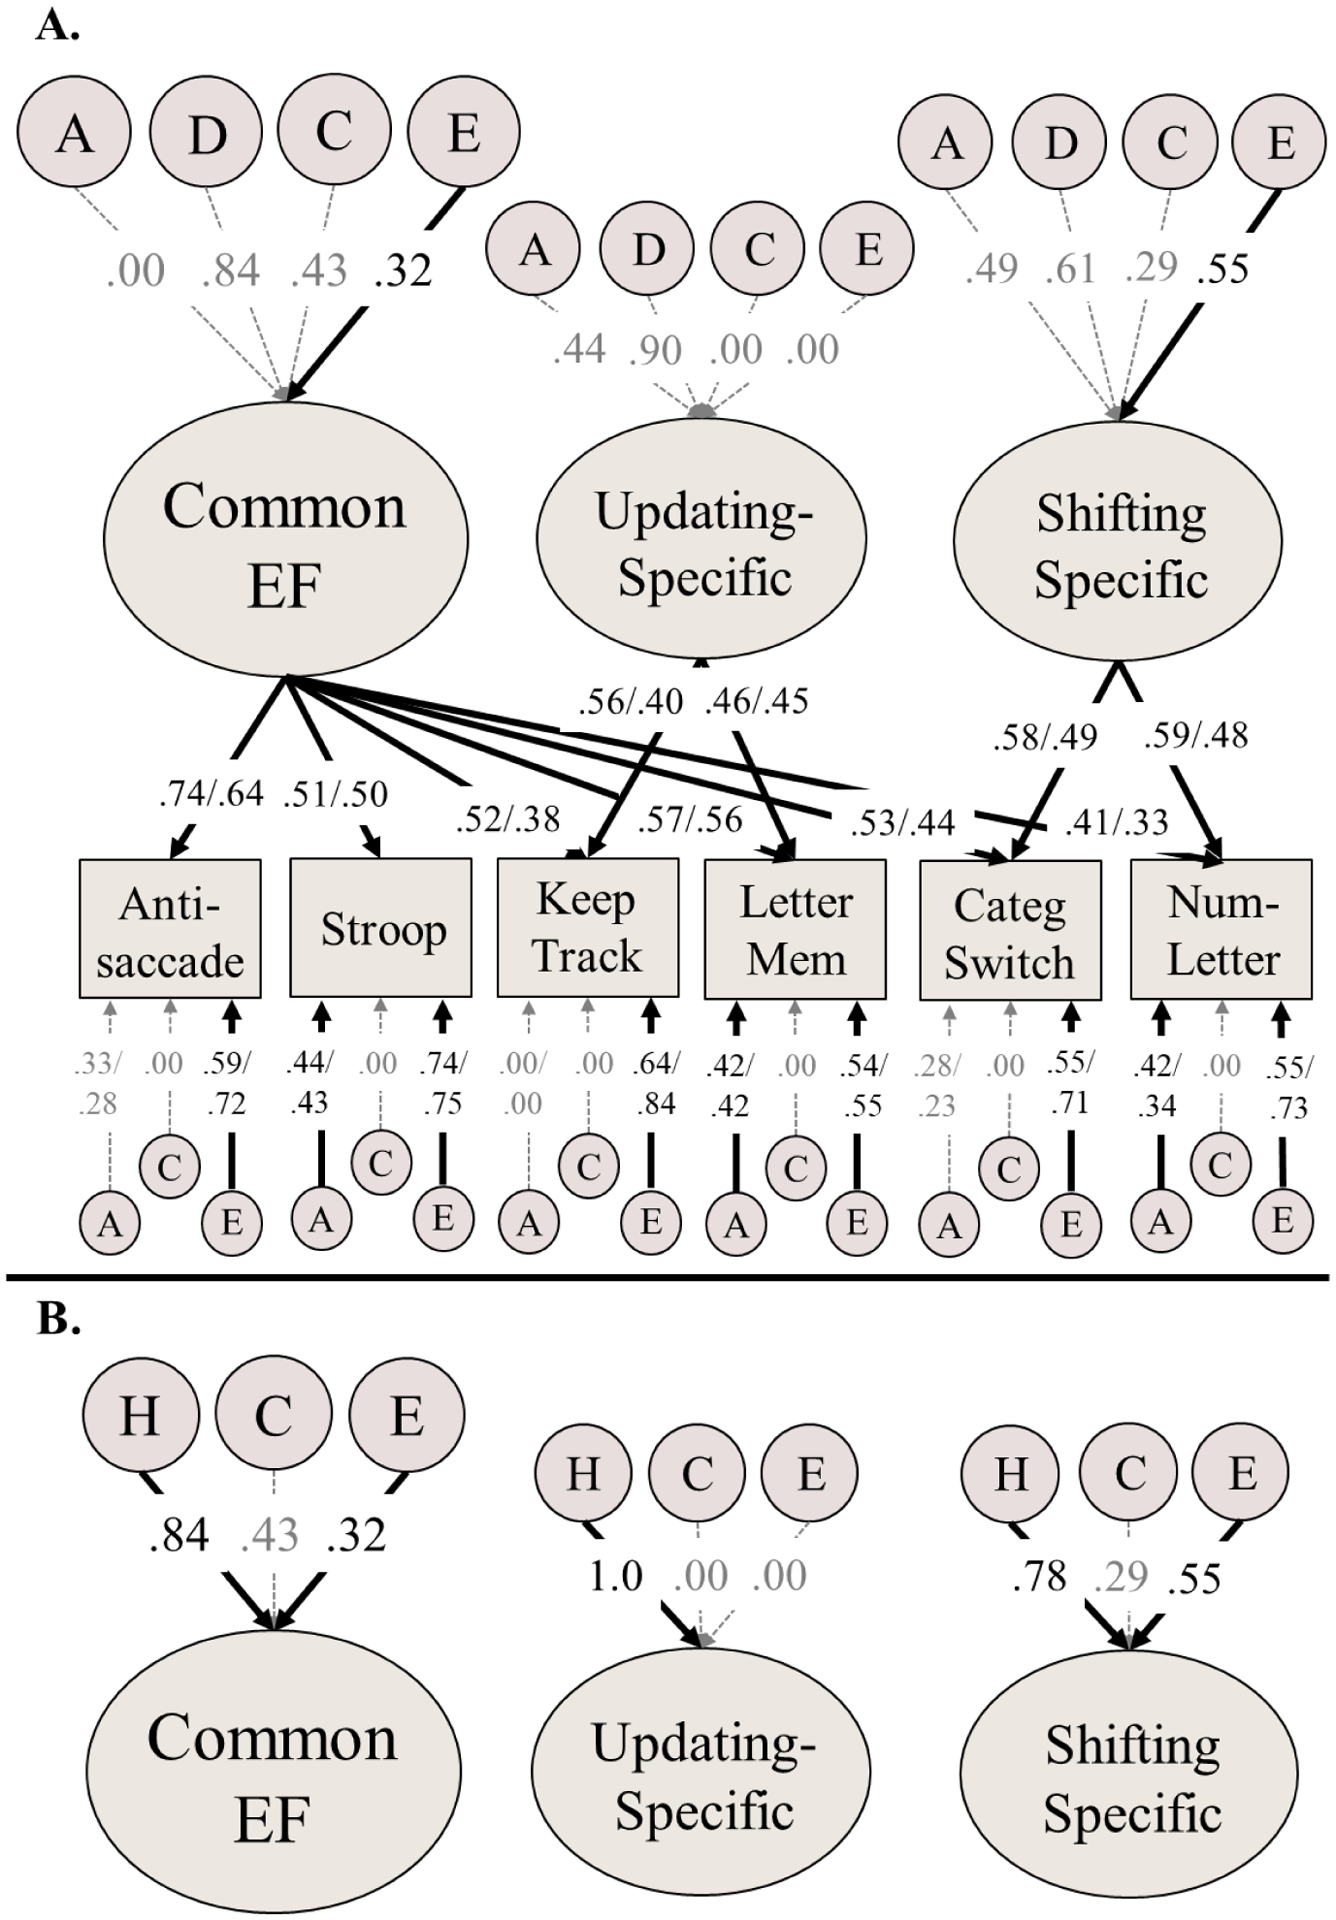
Figure 1:

Genetic model of executive functions (EFs). Panel B displays the same model, but results are plotted for broad-sense heritabilities (H = additive + dominance genetic variance).
Variance explained by latent variables (ovals) can be computed by squaring the factor loadings on measured variables (rectangles) or EF subfactors. Most paths were equated across subsample, but because residual nonshared environmental influences were allowed to differ, standardized estimates of factor loadings and residual A influences also differ across Longitudinal Twin Study subsample (LTS; left) and the Colorado Adoption Project subsample (CAP; right). Significant paths are displayed in black text, with solid black arrows (p<.05). Model fit: χ2(307)=464.09, p<.001, RMSEA=.026, CFI=.912. A = Additive genetic influences; C = Shared/common environmental influences; E = Nonshared environmental influences.
