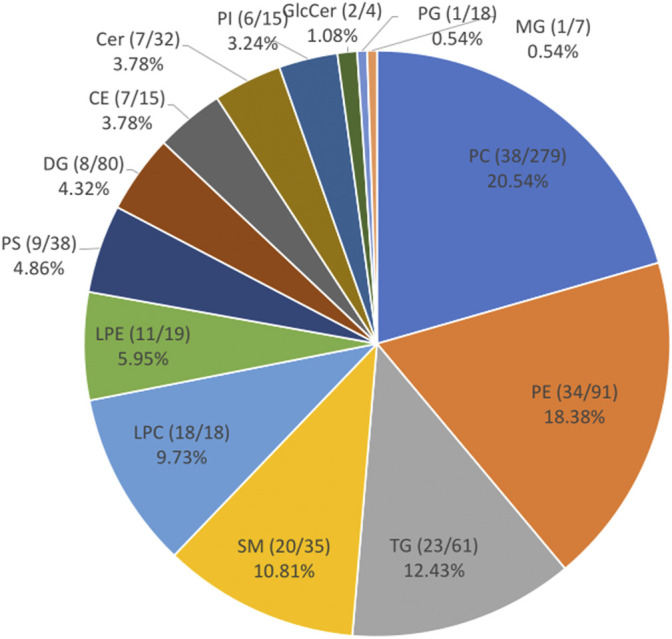
FIGURE 1.

The different classes of lipids identified in the serum of broilers from the pHu lines. The pie chart represents the proportion of each class of lipids in the lipidome of the pHu chickens identified by targeted lipidomics. The names of each lipid class is followed by: the number of lipids in each class/the number of lipids in the class in the database. PC, phosphatidylcholines; PE, phosphatidylethanolamines; PG, phosphatidylglycerols; PI, phosphatidylinositols; PS, phosphatidylserines; SM, Sphingomyelins; TG, triacylglycerols; CE, cholesterol esters; Cer, ceramides; DG, diacylglycerols; GlcCer, glucosylceramides; LPC, lysophosphatidylcholines; LPE, lysophosphatidylethanolamines; MG, monoradylglycerols.
