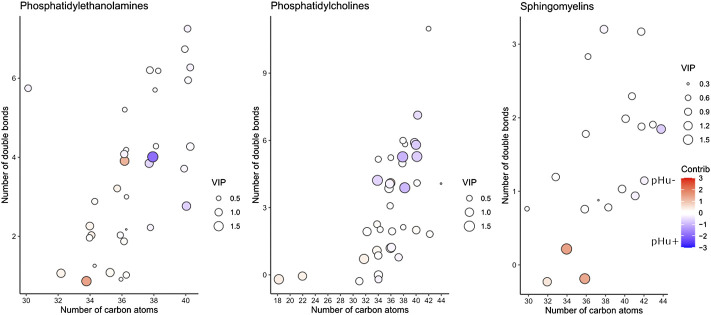
FIGURE 2.
Relation between lipids, acyl chain properties, and the pHu lines. The total number of carbons and unsaturation in the acyl chains of the lipids were plotted with the VIPs and the contributions extracted from the initial OPLS-DA model including the 185 lipids (Supplementary Table S2) identified by targeted lipidomics in the serum of broilers from the pHu lines (training dataset; n = 100 for each line). The importance of the lipids (VIP) in the OPLS-DA model (M1a) was represented by the size of the circle and the contribution to the pHu− or pHu+ lines were visualized by a gradient going from red (pHu−) to blue (pHu+). The characteristics of this OPLS-DA model (M1a) are 1 predictive and 3 orthogonal components, R2Y(cum) = 0.74 and Q2 (cum) = 0.56. Position jitter was introduced in the plots to avoid overplotting.

