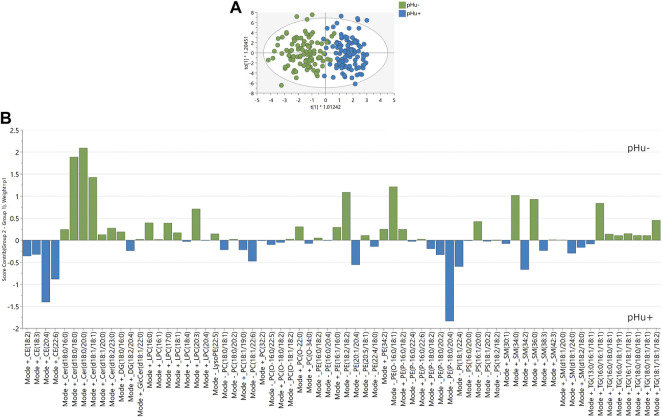
FIGURE 3.
Score and contribution plots following OPLS-DA predictive of the phu line. (A) Score plots following OPLS-DA (training dataset) with the chicken lines as categorial factor Y and the lipids as explanatory quantitative variables X. The pHu+ and pHu− individuals were represented by blue and green circles, respectively. The model (M1b) contained 68 lipids, 1 predictive and 3 orthogonal components and its descriptive and predictive performance were R2Y(cum) = 0.77 and Q2 (cum) = 0.67. (B) Contribution plot indicating the contribution of the lipids identified in the OPLS-DA predictive of the pHu lines.

