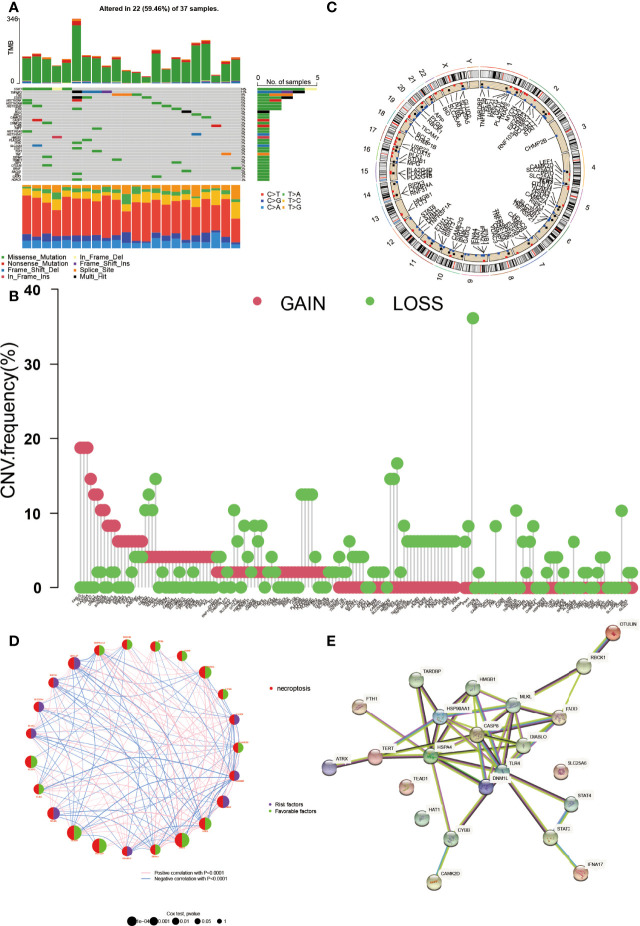
Figure 1.
The genetic landscape of NRGs in DLBCL. (A) The tumor mutation burden frequency and classification of NRGs in DLBCL. (B) The copy number variation (CNV) frequency of NRGs in DLBCL. The height represents the alteration frequency. (C) The location of the CNV alteration on chromosomes. (D) The gene interaction network of NRGs in DLBCL. The circle size indicates its significance. The right part of the circle represents its role, purple for risk factor and green for favorable. The line between genes means they were correlated with each other (p < 0.0001). (E) The protein–protein interaction encoded by NRGs in DLBCL by STRING.

