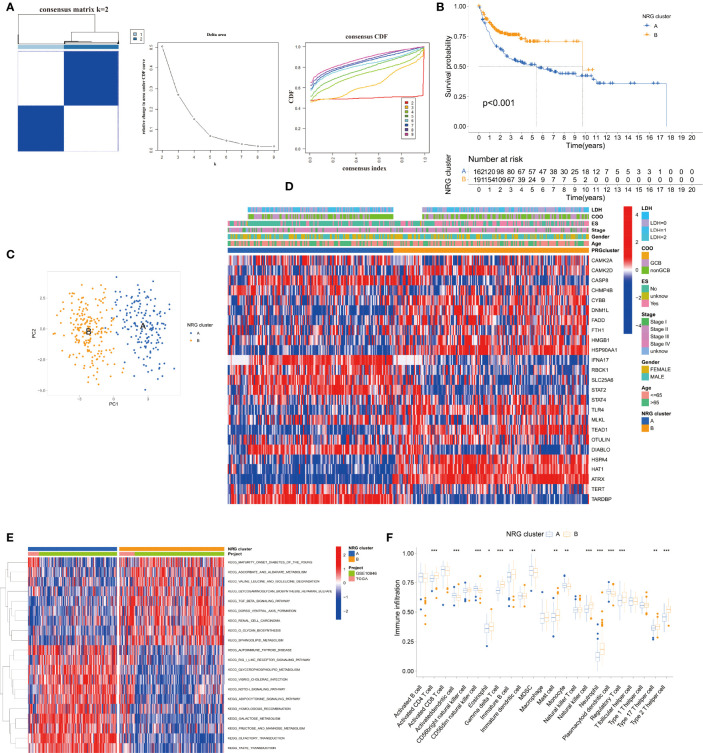
Figure 2.
Establishment and analysis of the NRG clusters. (A) The consensus matrix, delta area, and consensus CDF by cluster analysis based on NRGs. Two clusters would be best. (B) Kaplan–Meier survival curves of two NRG clusters (p < 0.001). (C) Principal component analysis of NRG clusters. (D) Heatmap of NRG clusters and clinical data of DLBCL patients. Data of lactate dehydrogenases (LDH) and cell of origin (COO) are missing. (E) KEGG pathway enrichment analysis between NRG clusters by GSVA. (F) Immune infiltration between NRG clusters by ssGSEA. *p < 0.05, **p < 0.01, ***p < 0.001.

