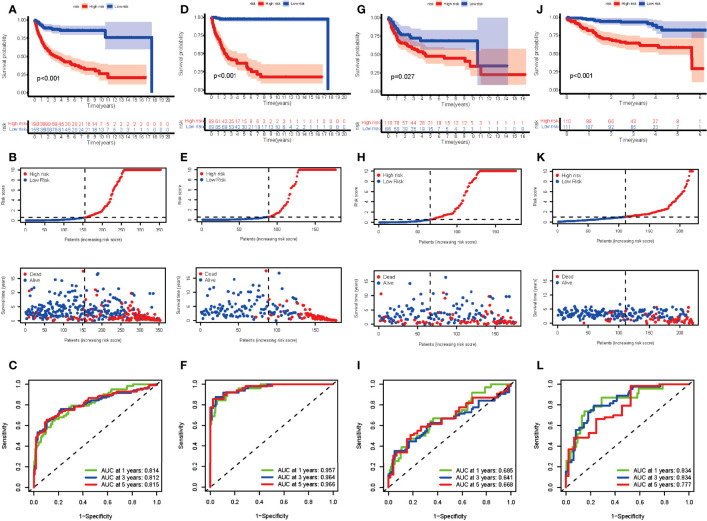
Figure 4.
Evaluation of the risk score in the entire, training, test, and external validation cohort. (A, D, G, J) K-M curve of the entire, training, test, and external validation cohort, respectively. The p-value is <0.001, <0.001, 0.027, and <0.001, respectively. (B, E, H, K) The risk curve and survival status curve of each cohort, respectively. (C, F, I, L) ROC with AUC at 1, 3, and 5 years of each cohort, respectively.

