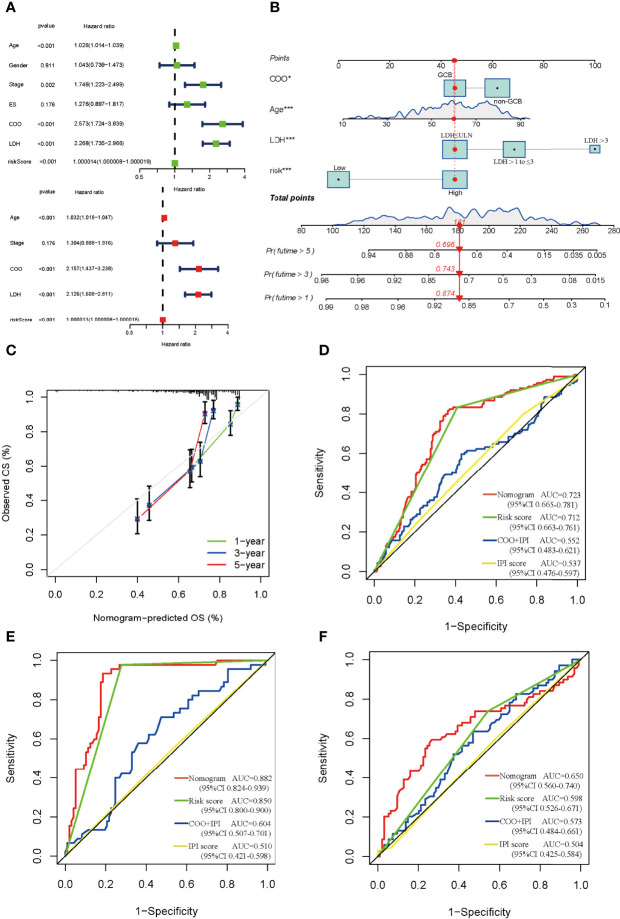
Figure 5.
Construction and estimate of nomogram. (A) The univariate (green) and multivariate (red) Cox regression analysis of clinical characteristics and risk score. (B) The nomogram integrating COO, age, LDH, and risk score for DLBCL patients. (C) The calibration curve of the nomogram at 1, 3, and 5 years, respectively. (D) ROC curve of the nomogram, risk score, COO+IPI, and IPI score. ROC curves of the nomogram, risk score, COO+IPI, and IPI score in the CHOP regimen group (E) and RCHOP regimen group (F). ES, extranodal sites; COO, cell of origin; LDH, lactate dehydrogenases; GCB, germinal center B-cell like; ULN, upper limit of normal.

