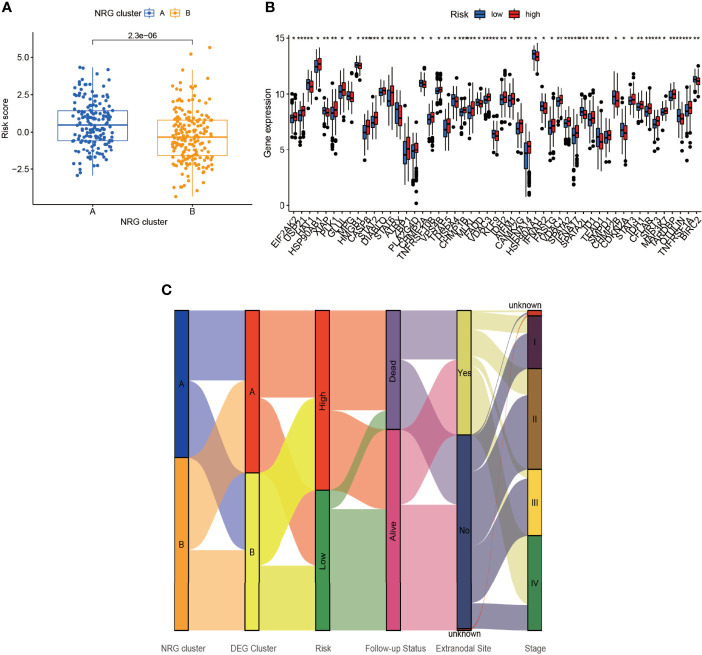
Figure 6.
Connection of risk score and NRG clusters. (A) The relationship of risk score and NRG clusters (p = 2.3×10⁻⁶). (B) The differential NRGs between the low- and high-risk group. (C) Sankey diagram including NRG clusters, DEG clusters, risk score, follow-up status, extranodal site, and stage. *p < 0.05, **p < 0.01, ***p < 0.001.

