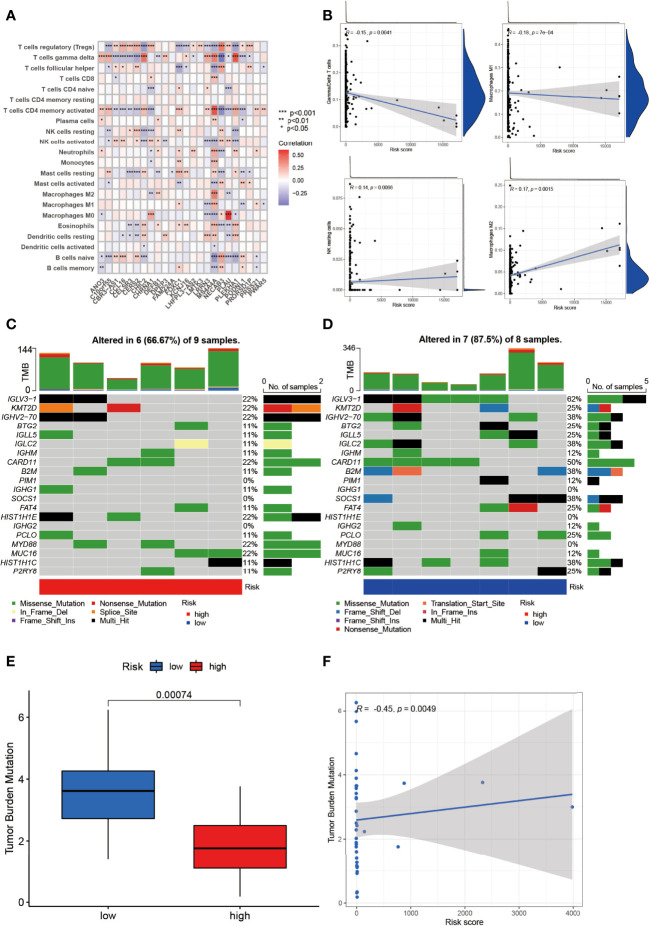
Figure 7.
Identification of immune infiltration and genetic variants underlying the different risk groups. (A) The correlation intensity between DEGs and immune cells. (B) The relationship of immune cells in risk score. γ/δ T cell and Macrophage 1 were negatively correlated with risk score while NK resting cell and Macrophage 2 were positively correlated (p < 0.01). The CNV frequency of (C) high-risk and (D) low-risk groups. (E) The TMB between the low- and high-risk group (p = 0.00074). (F) The correlation of TMB and risk score (p = 0.0049). *p < 0.05, **p < 0.01, ***p < 0.001.

