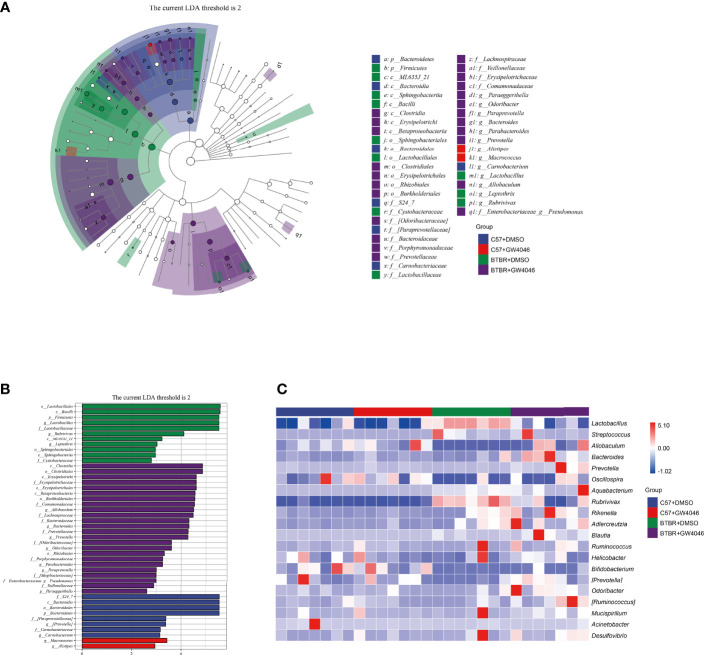
Figure 6.
Differential taxa abundance in the gut microbiota. (A) LEfSe analysis of gut microbiota in mice, depicting the taxonomic association between microbiota communities among the four groups. Each node represents a specific taxonomic type. White nodes denote the taxonomic features that are not significantly differentiated. Blue, red, green, and purple nodes respectively denote the taxonomic types with more abundance than in other groups. The larger the diameter of the nodes, the more significant the difference. (B) The histogram of LDA value distribution and the evolutionary branch diagram of LEfSe analysis show the species whose LDA Score is higher than the set value (LDA score >2, P < 0.05). The histogram’s length represents the impact size of different species (LDA Score), and different colors represent the species in different groups (blue:C57+DMSO; red:C57+GW4064; green:BTBR+DMSO; purple:BTBR+GW4064). (C) Heatmap of selected most differentially abundant features at the genus level. The blue color represents less abundant, the white color represents intermediate abundance and red represents the most abundant. n = 7.

