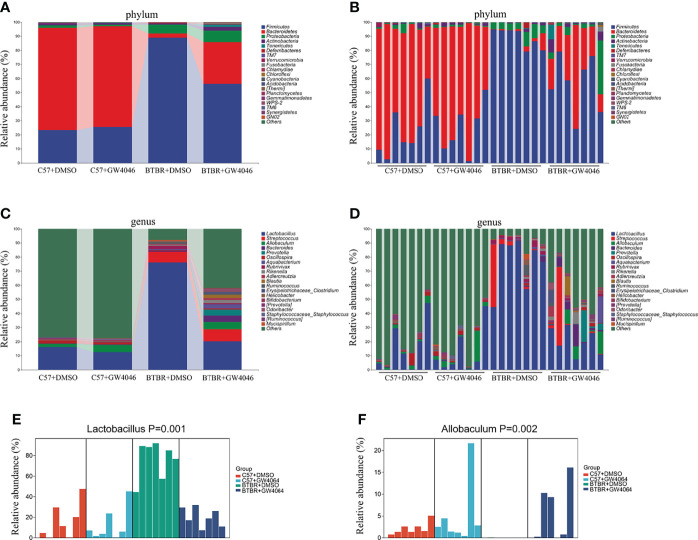
Figure 7.
GW4064 treatment changed the autism-associated microbiota dysbiosis. (A, B) Bar plots of the phylum taxonomic levels among four groups (only the top 20 phylum bacteria are shown). Relative abundance is plotted for each sample (B) and the average of each group (A). (C, D) Bar plots of the genus taxonomic levels among four groups (only the top 20 genus bacteria are shown). Relative abundance is plotted for each sample (D) and the average of each group (C). (E) The relative abundance of the genus Lactobacillus in each sample was displayed by bar plots. (F) The relative abundance of genus Allobaculum in each sample was displayed by bar plots. n = 7.

