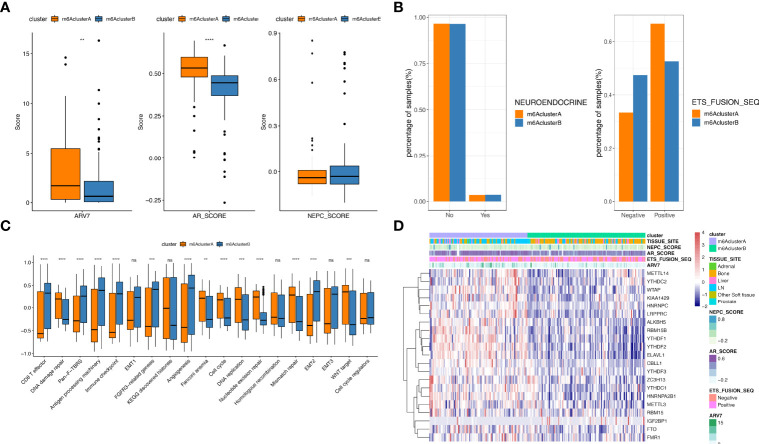
Figure 3.
Comparison analysis among m6A clusters. (A) The distribution of ARV7 (left), ARscore (middle) and NEPCscore (right) between the two m6A clusters; (B) The prognostic differences between the two m6A clusters; (C) Results for GSVA analysis of prad_su2c_2019 cohorts; (D) The expression of m6A regulator genes in two m6A clusters extracted from prad_su2c_2019 cohorts. ns represents P > 0.05, **P ≤ 0.01, ***P ≤ 0.001, ****P ≤ 0.0001.

